Category Archives: Dow Theory Confirmation

NLO Market Indicator – Dow Theory Indicator February 2021

The market's recent run-up coupled with volatility may cause some concern for market participants. As recent as last Monday, February 12th, we received a confirmation of the rising trend based on Dow Theory. Both the Dow Jones Industrial Average and Dow Jones Transportation Average closed at their all-time high.

To that point, we want to discuss a proprietary market indicator which shows the state of the market. We will reveal the details of the indicator but the essential components are the Industrials and Transports which provide us with the longest history of data to back-test.

The chart below shows the S&P 500 in blue plotted against the indicator which we will call Dow Theory Indicator. The one million dollar question is how do we know when a substantial market correction is coming. This isn’t an exact science but this is our best attempt. Typically, we see that the market (S&P 500) fails to break above the high and Dow Theory Indicator drops into negative territory. Continue reading

Dow Theory: August 2018

Review

On May 10, 2018, we said the following of the Dow Jones Industrial Average and Dow Jones Transportation Average:

“…we want to know whether these two indexes decline below the late March (Industrials) and early April (Transports) lows.  A joint decline below these levels would be the strongest indications that a bear market is eminent.”

Since that time, neither index fell below the indicated low points.

Continue reading

Dow Theory: Are We There Yet?

In our last Dow Theory assessment dated May 17, 2015, we said the following:

“We’re looking for a bear market indication with a declining of the Industrials, Transports and Russell 2000 below their respective February 2015 lows followed by a decline below the October 2014 lows. In addition, we’re looking for the revised data in the Industrial Production Index to continue in the current declining trend.”

Since May 2015, there has been a lot of action but not a lot of substance.  Below is our Dow Theory update explaining why a bear market was not signaled in August of 2015 and what to watch for going forward.

Continue reading

Dow Theory: September 18, 2014

NOTE: In our  Dow Theory posting of May 18, 2014, we revealed an issue with Dow Theory that had gone unaddressed since S.A. Nelson’s book, The ABC of Stock Speculation, coined the term “Dow’s Theory.” We believe the acknowledgment of this issue adds clarity to the writings of Charles H. Dow and may produce new insights that have not previously been explored.

Continue reading

Dow Theory: August 14, 2014

In our last Dow Theory posting on May 18, 2014, we revealed an issue with Dow Theory that had gone unaddressed since S.A. Nelson’s book The ABC of Stock Speculation coined the term “Dow’s Theory.” We believe the acknowledgment of this issue adds clarity to the writings of Charles H. Dow and may produce new insights that have not previously been explored.

Continue reading

Dow Theory

Continue reading

Dow Theory Update

We may be on the cusp of a Dow Theory cyclical and secular bull market signal.  However, where the rubber hits the road when it comes to Dow Theory is discretion and confirmation.  Discretion is needed for the purpose of avoiding frequent and erroneous calls. Confirmation is needed to ensure the quality of the analysis. We’re hoping that the chart below clarifies what investors need to know about the recent stock market activity.

Continue reading

Dow Theory

How long does a Dow Theory Primary Bull Market last?

Recently, some followers of Dow Theory had suggested that a new primary bull market began on June 4, 2012. Those same Dow Theorists are now put in the awkward position of changing that primary bull market call to a primary bear market indication as recently as November 11th or 16th of this year.

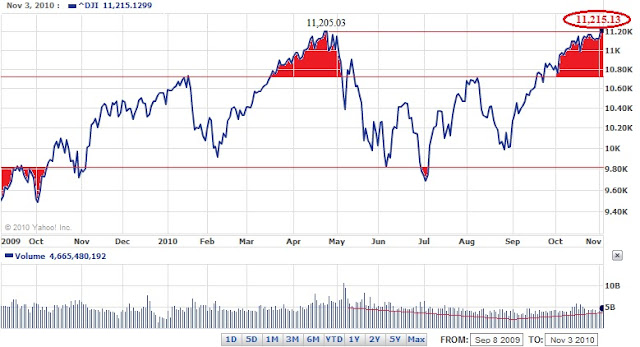
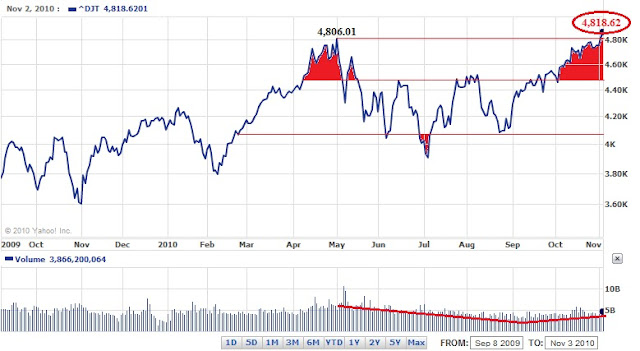
However, when doing the math, those Dow Theorists who claimed that a primary bull market began on June 4, 2012 have very little to show for it, especially when, by their own account, a primary bear market was signaled on November 11th or 16th. To demonstrate how inaccurate that analysis was, since June 4th, the Dow Industrials has increased +4.02% while the Dow Transports increased +0.90%. Even in the period from June 4th until the respective peaks, the gains were marginal with the Dow Jones Transportation Average gaining +8.31% by June 19th without being able to exceed the 2011 peak. At the same time, the Dow Jones Industrial Average gained +12.47% by October 5th without being able to exceed the 2007 peak. The inability to exceed prior all-time highs is uncharacteristic of what one should expect of any market move deemed a “primary bull market.”

In all of the history of the Dow Industrials and Dow Transportation Averages, primary bull market moves have never lasted for only 5 months. The following examples from renown Dow Theorists suggest that any indication that a primary bull market began in June 2012 and ended in November 2012 was done so in error.

When William Peter Hamilton wrote on the topic of the primary bull market movements in his book Stock Market Barometer, he said the following:

“The average duration of six major bull swings is twenty-five months…(page 44).”

According the Robert Rhea’s book The Dow Theory:

“…a primary bull market is a broad upward movement, interrupted by secondary reactions, and averaging longer than two years (page 44).”

From E. George Schaefer’s book How I Helped 10,000 Investors to Profit in Stocks comes this conclusion:

“…in primary bull markets the duration of a typical primary up-trend might last from four to eleven years…(page 42)”

It is more likely that a primary bear market can last as little as 5 months due to panics and crashes. However, in order for Dow Theory to be worth its weight, a primary bull market should see an investor through an extended period of time (at minimum 12 to 18 months and usually 2 years or more) and not a period of less than 6 months.

Dow Theory: The Backdrop 

On August 2, 2011, Dow Theory provided us with the first primary bear market signal since the primary bull market indication of July 23, 2009.  This bear market indication came with a very interesting backdrop that is worth reviewing. On the very same day as our bear market indication (Aug. 2, 2011), the Senate passed the bill allowing for the extension of the debt ceiling (found here). The Senate vote came one day after the House of Representatives approved legislation to raise the debt ceiling to $14.3 trillion (found here).

The discussion and debate prior to the actual passage of the bill, allowing for the debt ceiling increase, suggested that the country would suffer irreparable damage if Congress didn’t come up with a solution.  Once the bill was passed, Congressional members were as giddy as can be.  There was a lot of back slapping and praise because both sides of the aisle could finally agree on something. 

Suffice to say, only three days (Aug. 5, 2011) after the “bipartisan” agreement to raise the debt ceiling, Standard & Poor's lowered the credit rating of the United States indicating that “…the downgrade reflects our view that the effectiveness, stability, and predictability of American policymaking and political institutions have weakened at a time of ongoing fiscal and economic challenges to a degree more than we envisioned…” (PDF found here).

We wince when politics has to enter our discussion of the markets since we know that there are no winners when it comes to such a debate.  However, we have reminded readers of the backdrop at the time of the Dow Theory bear market indication to suggest that we may actually be sitting on another “buy the rumor and sell the news” scenario when the resolution of the “fiscal cliff” arrives.  From the May 3, 2011 to August 1, 2011, the Dow Jones Industrial Average declined –5.27% and from August 1, 2011 to August 10, 2011, the Dow Jones Industrial Average declined –11.64%.  It appears the stock market anticipated that the debt ceiling would be increased and that ultimately it would be to no avail, resulting in the downgrade from S&P. 

Already, the Dow Jones Industrial Average has declined –7.5% from the October 5, 2012 high.  Are we slated for a similar reaction to the ultimate “resolution” of the “fiscal cliff” that currently overhangs the U.S.?  It is interesting to note that the increase of the debt ceiling and the “resolution” of the “fiscal cliff” will have a negative effect on the U.S. despite the two political parties’ shameless self-promotion for acting in a bi-partisan manner to come to a “resolution.”  If the S&P downgrade of the U.S. came 3 days after the agreement to raise the debt ceiling and a stock market plunge of –11% in seven trading days later, what can we expect when the “fiscal cliff” passes?

Also, keep in mind that with the announcement of QE3 on September 13, 2012, the stock market has declined as much as -7.02%.  All prior announcements of quantitative easing by the U.S. and European Union were not accompanied with almost immediate declines in the stock market. It appears that the quick fixes are having less of the desired short-term impact since it is clear that the long-term effects of such strategies are harmful and possibly irreversible.  Our article on the diminished impact of QE3 can be found here.

We can’t be sure if the past provides any lessons, however, the solution to the “fiscal cliff” may lead to an outcome that is far worse than anticipated.  While everyone in Congress was suggesting that there were going to be dire consequences to not raising the debt ceiling there were few that anticipated that the S&P would downgrade the debt anyway.  Likewise, providing a solution to the “fiscal cliff” cannot hid the fact that the U.S. is a house that is not in order.  Resolving issues like the debt ceiling with increasing the debt “limit” or the “fiscal cliff” with less cutting and more spending than initially planned, with politicians whose goal is to posture until the 11th hour, suggests that S&P’s downgrade of the U.S. debt will be looked upon in retrospect as an understatement.

Dow Theory: Bear Market Confirmation Due

Starting with the movement of the Dow Industrials and Transports, we can seen that the primary bear market began on August 2, 2011.  Since that time, the bear market rally (from the August 8, 2011 or October 3, 2011 low) has been very rewarding to anyone who followed our August 9, 2011 (found here) indication that a temporary bottom had been reached.

image

Now that there has been a substantive decline in the Industrial Average below the April 30, 2012 peak we can see that any decline below the June 4, 2012 low is the level to watch for.  Again, Dow Theory indicates that for any signal to have merit, both the Industrials and Transports must simultaneously rise above prior peaks or decline below prior troughs.  In order for us to get a bear market confirmation, we’d need the Industrials to decline below 12,101.46 and the Transports to fall below 4,847.73 on a closing basis. 

So far, the Industrials are +4.02% above the June 4th low while the Transports are +0.90% above the mid-year level.  If either of the indexes fail to fall below the June 4th level we have to put our bear market thesis on hold.

Dow Industrial Upside Targets

The decline that the Dow Jones Industrial Average has experienced isn’t out of the ordinary.  However, it is our responsibility to review the prospects of an upside target based on Dow Theory.  Taking the most recent intra-day low of 12,471.50 and projecting to the most recent intra-day high of 13,661.90 provides us with the following upside targets:

image

Each move up to the 13,066.69 level carries the risk that at any point the market can easily descend below the 12,471.50.  However, exceeding 13,066.69 and especially the points above the 13,265.10 connotes the prospect that the Dow Industrials can achieve 13,661.90.

Dow Theory: Downside Prospects

We have indicated in our August 2, 2011 posting (found here) the fact that we are now in a bear market.  According to Dow Theory, the primary trend remains in place until the opposite indication has been signaled.  This is best described by Richard Russell in the following remark:

…the Dow Theorist has learned that the last trend should be considered to remain in effect until the contrary has been proved”[1].

We believe that there has not been a reversal of this bear market indication as outlined in our August 7, 2012 Dow Theory analysis (found here).

Despite getting a bear market signal only days earlier, on August 9, 2011 we indicated that a bear market rally (found here) was likely to take place.  Our work on the topic of Dow Theory at that time indicated that there was upside potential to go as far as the prior highs (12,807.51).  From the August 9th low, the Dow Industrials rose as high as 13,338.70, or +23.38%.

From our experience on the topic, bear markets usually connote declines of -30% or more.  However, the bear market that we’ve experienced so far can be characterized from a slight dip to a nice market run to the upside.  While the Dow Jones Industrial Average and the Dow Jones Transportation Average have diverged overall, there has been nothing that we’ve seen since August 2, 2011 to make a person feel like any confidence in the indication.  After all, it has been over a year since the signal and no real fireworks.  Was it really worth reducing market exposure for a non-event?

Since this bull market move began on March 9, 2009, there have been sizable declines of -14% or more in 2010 and 2011 before the stock market continued higher.  The best we can do at this point is assume that 2012 is due for a correction in line with the two previous years and see what the downside prospects might be.

period of decline Dow Industrials % change
April 26, 2010-July 2, 2010 -14.60%
May 2, 2011-October 3, 2011 -19.19%
May 1, 2012-???? -2.09%
   
   
period of decline Dow Transports % change
May 3, 2010-July 6, 2010 -18.72%
July 7, 2011-October 3, 2011 -28.11%
March 15, 2012-???? -6.39%

Because a bear market decline of -30% or more has not taken place, the best we can do is assume that a similar decline to 2010 and 2011 is the most likely outcome…for now.  The previous declines, within the context of a bull market, have averaged –16.90% for the Dow Industrials and –23.42% for the Dow Transports. 

If the Industrials were to decline from the current level by –16.90% it would fall to 11,035.12.  If the Transports were to decline from the current level by –23.42% it would fall to 4,096.84.

As described in our Dow Theory analysis from August 7, 2012 (found here), there are two overhanging non-confirmations of a bull market.  This means that the overall trend of the Industrials and Transports should eventually be down.  In our negative bias against an new bull market, particular emphasis is weighted against the Transportation Index which has been falling while the Industrial Index has been rising.

However, the last week of August has provide the Dow Industrial Average with what we consider a double-top.  Although not the most classic double top, it is still a double top. 

image

Double tops and double bottoms were indicated to be very important formations according to Charles H. Dow.  Alternatively, William Peter Hamilton and Robert Rhea arrived at the conclusion that such formations bear little importance when considering the price movement of the indexes.

From our own work on the topic of double tops and double bottoms, we have found that Dow was right about the importance of such a price characteristics and have been able to prove, with significant evidence throughout the history of the Dow indexes, that double tops and double bottoms are critical indicators for determining market direction when applying Dow Theory. 

In this case, a double tops mean that the direction for the stock market is down.  Since the bear market signal, based on Dow Theory, hasn’t resulted in a decline of over -30% for either the Transports or Industrials, were proposing that at the very minimum a decline of 13%–15% should be expected.

[1] Russell, Richard. Richard Russell’s Dow Theory Letters. Issue 166. December 27, 1961. page 1.

Dow Theory Update

It appears that Dow Theory is not understood, by even the best in the industry.  In an article titled “The Meaning of the Transports’ Weakness,” Mark Hulbert surveyed some of the industry’s best Dow Theorists for a clue as to what the market was expected to do next. What stands out in this article is the following remark:

“Frustratingly, not all Dow Theorists agree on an answer. In fact, two of the three monitored by the Hulbert Financial Digest — Jack Schannep of TheDowtheory.com and Richard Moroney of Dow Theory Forecasts — think the appropriate point of comparison is not last summer but late October. And because, near the end of December, the Dow averages rose above their late-October highs, both Schannep and Moroney believe that the Dow Theory is solidly in the bullish camp — notwithstanding where the Dow transports might be relative to their July high.”

Within this commentary is a revealing explanation as to the reason why we believe that Schannep and Moroney got it wrong, thereby issuing a bear market indication in August 2011 and a bull market indication in late December 2011.  In order to understand this, we must first point out a diagram of how Dow Theory reversals typically occur.

Plotting of Primary Reversal

Courtesy of Richard Russell’s Dow Theory Letters (www.dowtheoryletters.com), Figure 1a and Figure 1b show how the Industrials and Transports need to retest prior lows established at point A.  This retesting of the prior low would come after a medium-term rise at point B.  Once the market rests the prior low, the market would then need to exceed the medium-term high of point B.

With the diagram above, we can now see how Schannep and Moroney could have considered that a new bull market was in the making.  Once the market exceeded what they believed to be the POINT B in figure 1a and 1b, it then appeared to be a new bull market.  Unfortunately, while the Dow Industrials appeared to follow the script in Figure 1a, the Transports were far behind in providing a similar pattern of retesting the previous low.  This error led to an incorrect assessment of a new bull market.

Interestingly, Schannep and Moroney were inaccurate even in their call of a “bull market” using Dow Theory.  Based on the diagrams of figure 1, a new bull market should have been indicated in early October instead of late December.  In the chart below, it should be noted that the false bull market indication in October had much more to gain than the late December indication.  Worse still, only a month later, in February 2012, the Dow Transportation Average starts to diverge from the path of the Dow Jones Industrial Average.

2012 03 06 Dow Theory

The current divergence between the Industrials and Transports is a confirmation of the bear market trend.  Additionally, we expected that the Industrials and Transports are going to re-test the lows of 2011.  However, our suspicion is that both the Transports and Industrials will sink below the 2011 lows and possibly go strait to the 9,700 level on the Industrials.  The prospect remains that the bear market could potentially end if the Transports retest the lows of 2011 without falling significantly below.

As early as October 15, 2011 (article here), we indicated that the “…coming market volatility will provide great opportunities for traders and allow investors a chance to cash out of otherwise undesirable positions and take profits. Our expectation is that the Dow will go to the July 2011 highs before struggling at the May 2011 highs. Again, we’re still in a cyclical bear market until the Transports and Industrials exceed their respective 2011 highs.

We hope that our readers have benefitted from our advice to unload undesirable positions.

Best regards.

Dow Theory: Continuation of Bull Market Confirmed

In our last discussion of Dow Theory on September 8, 2010, we indicated that the Dow Industrials and Dow Transports had formed a line. The line that we discussed in the September 8th article was broken through on the upside in the month of October. According to William Peter Hamilton, a line in the market could be considered as important as a market crash. We decided against a reaction on the line being broken to the upside out of concern for jumping the gun. To be conservative on the topic of Dow Theory, we opted for the sure fire signal of a continuation of the bull market trend with the markets making new highs above the April/May points.
On November 3, 2010, the Dow Industrials confirmed the Dow Transports breach of the their respective highs since the 2009 bottom. The new high came on the news that the Federal Reserve is going to fully implement quantitative easing (QE2) to further boost the economy. In addition, the new high arrived as the results of the November 2nd election were finally in. We are not surprised of the coincidence of QE2 being introduced immediately after the election results. Our last article on the topic Dow Theory on September 8, 2010 closed with the following commentary:
Politicians vying for re-election will fight tooth-and-nail against outcomes that don’t ‘appear’ positive. With this in mind, it is possible that the only option is to the upside.”
With this confirmation, we can only guess as to where the next stop for the markets might be. However, in our February 12, 2009 article, we discussed the idea that when the stock market falls 40% or more there is the tendency to retrace 50%-100% of the prior decline. So far the Dow Industrials have retracted 61% of the previous decline from 14,164.53. With the introduction of QE2 at this point in the game, we’re likely to achieve 100% retracement of the market from the October 2007 top.
With a goal of self-preservation in mind, we have the tendency to believe that the market is always going to fall rather than head higher. This time is no different. However, the Dow Theory signal is telling us that as long as we don’t get a sudden reversal of the trend we’ve got at least another 3 to 9 months of an upward bias in the stock market and the economy. Our September 8th article said:
the length of time that has been spent in such a range seems to indicate that we’re due for a breakdown or an explosion if the markets cross below or above the range.
As a result of breaking above the line and the previous high, we may experience the oddity of a full-fledged financial stock panic to the upside regardless of whether it is warranted or not. Basically, this could be the final blow-off before attaining the cyclical bull market top.
Downside targets for the Dow Jones Industrial Average are:
  • 10,000
  • 9,500
  • 8,000
Because we have a natural bias against the upside prospects, we caution all investors to pay close attention to the downside targets. All new investments should be with the acceptance that the Dow Industrials could fall to the 8,000 level without warning. However, facts being what they are, Dow Theory seems to be pointing the way for the economy and the stock market.

Please revisit New Low Observer for edits and revisions to this post. Email us.

Dow Theory

On Friday April 9, 2010, the Dow Jones Industrials and the Dow Jones Transportation Averages both moved to new highs at the same time. According to Dow Theory, this confirmation by both averages would indicate that the market has more room to go on the upside before a change of direction is to take place.
The path to this bull market confirmation (within a secular bear market) has been a battle with many casualties. The last week had many examples to demonstrate this point. On April 5th, the Industrials broke to a new closing high however the Transports did not confirm. On April 6th, the Transports broke to a new high but the Industrials did not confirm. On April 8th, the Transports broke above the high that was established on April 6th however the Industrials could not exceed the previous high of 10,973.55 set on April 5th.  April 9th finally cleared the air on the much needed confirmation of the market's trend.
The factors that are in favor of the continuation of the bull market are that the Industrials and Transports are 50% above their respective 2007 to 2009 declines. Additionally, prior declines within secular bear markets like 1906 to 1924 or 1966 to 1982 have had many retrenchments of 80% to 100% before falling back to the old lows. So far, the Industrials have recouped 58.42% of the previous decline. If the Industrials were to retrace a classic Dow Theory 2/3 of the previous decline, the index could go to 11,574.59 with no problem.
However, the tepid nature of the gains that led to the new highs along with the lackluster volume that has accompanied the move up from the March 9, 2009 low doesn’t seem to encourage confidence in the direction. More alarming is the fact that we are not near historical levels of under-valuation in the market in general. The Dow Industrials currently has a dividend yield of 2.48% when the long-term average high yield is around 6%. Also of concern is that the Dow Fair Value is at 6.92 times the dividend yield. This is contrasted with the 1.52x that is normally associated with great buying opportunities.
The former editor of the Wall Street Journal and Dow Theorist William Peter Hamilton once said, “the wish must never be allowed to father the thought.” For this reason, we will take a wait and see approach to the market going forward.  However, until proven otherwise, we are on a march back to Dow 14,164.53, which was set on October 9, 2007. In anticipation of the rise to the old market high, we have illustrated, in the chart below, three upside scenarios for the Dow Industrials.
The first projection (green line) assumes that the Industrials will continue the torrid pace set from March 9, 2009 to January 19, 2010. The likelihood of the index continuing at such a pace is not expected. However, in the book Charles H. Dow: Economist by George W. Bishop, Jr., it is noted that, according to Charles Dow, there are two stages to a bull market in stocks and that the second stage is more bullish than the first stage. This contrasts sharply with Robert Rhea and William Peter Hamilton’s assertion that there are three stages to every bull and bear market. If we are in the transition to the “second and final” stage of this bull run then it is possible for the market to continue on, and possibly exceed, the first trajectory that was previously set. The projected date that the Dow would reach 14,164.53 is November 19, 2010.
The second projection (blue line) is based on the March 9, 2009 to April 9, 2010 action on the Dow Jones Industrials. This pace seems more realistic than the first projection since it assumes a less dramatic increase in the index. To think that the market could continue moving higher as it had in the past would be quite unrealistic. Based on the current trajectory the Dow would reach the old high by January 31, 2011.
Finally, the third projection (black line) is based on the current trend being the mean and the first projection being the high end of the range. The third projection is a mirror of the first. The third trajectory would reach the old high by June 18, 2011.
Although we have a clear bull market confirmation (within the context of a secular bear market) it is necessary to determine where the downside targets should be. According to Dow’s Theory the following are the targets for a subsequent decline:
  • 9513.92
  • 8030.49

In addition to the normal downside targets, there is the prospect that if the Dow falls below the imaginary third projection level (black line), then all bets are off.  From the current Dow Theory confirmation, if the index cannot retains the level of 10,997.53 beyond July 15, 2010, then the market should have a major correction shortly thereafter.
Reaching the old high is all within the context of a normal secular bear market. The tendency is for the market to get to the old high and then quickly wipe out the notion that a new secular bull market is about to begin. This is the nature of a secular bear market.
Useful References: 

Email our team here.

Dow Theory

On October 16, 2009, I wrote an article on SeekingAlpha.com titled “Stock Market Projections,” where I attempted to predict the next low point for the Dow Industrials. In that article I said:
After I ran the numbers, the cycle analysis method indicates that from January 24, 2010 to February 15, 2010 is the next expected low.”
Eerily, the Dow Jones Industrial Average has managed to hit a major low on February 8, 2010. This is almost exactly in the middle of the range where, based on cycle analysis, the Industrials were expected to go. At the time it was my assertion that after hitting the low in February 2010 we could expect that the next move upwards would be to the 12,000 level.
The case for the move upward has been bolstered by the fact that, according to Dow Theory, the Industrials and the Transports have exceeded their January 2010 highs based on the closing price of March 18, 2010. However, as the Industrials have exceeded their March 18th closing price the Transports have not followed through so far.  This type of divergence between the two indexes is generally considered to be a non-confirmation.
The great Dow Theorist Richard Russell (Dow Theory Letters) has spoken at length about non-confirmations in the indexes and how to interpret the trend of the market in this context. According to Russell:
"It is a reasonable practice in areas of non-confirmation or divergence to give precedence to the primary direction. Thus, after a rally in a bear market, when one Average refuses to confirm the other on the upside, the strong presumption is that the next direction of the market will be down. More positive proof is provided if the two Averages then retreat below previous minor decline lows. The converse of this is true in a bull market, and many impressive advances have been “tipped-off” in areas where one Average refused to follow (confirm) the other through an important low point."
Richard Russell, Dow Theory Letters, Issue 102, May 2, 1960, page 2. www.dowtheoryletters.com
We would not be totally satisfied with the bull market indication (within a secular bear market) until the Transportation Index is able to go above 4422.50. However, until that time, we would consider this a bull market that is waiting for a confirmation rather than a potential bear market in the making. While we’re still sticking to a projected Dow Industrials of 12,000, the market has seemed to run out of the explosive bursts on the upside that it once had. Despite this concern, we wouldn’t be surprised of the market truly melted up from the current level.
  • The article on Seeking Alpha titled “Stock Market Projections” is here.
  • For better viewing, the chart in the article is here

Email our team here.

Lessons Learned From Our Worst Picks

In response to our “Worst Performing Picks” article, a reader asks:
“Is there some common trait among these 5 that, if known, could be used as a red flag or indicator not to repeat a future sub-optimal purchase?”
Touc’s response:
This is the payoff question and is worth its weight in your favorite commodity.
First and foremost, in four of the 5 stocks, we didn’t adhere to our own rules. One rule is to side-step stocks that have had recent cuts or no annual increase in the dividend. At the time, we didn’t wait to confirm if Masco (MAS) would increase the dividend in April 2008. Also, we didn’t wait to see what would happen after the dividend cut by Nucor (NUE) in March 2008. The concept of confirmation is incredibly important in Dow Theory, by ignoring this principle we cornered ourselves with bad recommendations.
What we should have done is wait one full year after the cut, or lack of an increase, to determine the viability of the company. Keep in mind that a cut in the dividend isn’t a death sentence. In fact, cutting the dividend might be the best management move to make. However, current shareholders of the company might abandon the stock if they have a policy to hold stocks with a steady dividend (as we advise investors to do.) We jumped the gun on Masco (MAS) and Nucor (NUE) when all the economic tealeaves were saying things weren’t looking good. I mean, how could we ignore the fact that a home building supplier and a steel maker were going to have some troubles with a declining housing market?
The next rule of ours that we violated was not issuing a sell on Illinois Tool Works (ITW) and American National Insurance (ANAT) after substantial gains in a short period of time. Illinois Tool Works (ITW) rose 9% in one month while American National Insurance (ANAT) rose 15% in less than one month. It is not that we want to be traders however, if the market gives you in one month what is considered to be the historical annual average gain over the last 100, 50, 25, and 10 years then we should thank our lucky stars and move on. In the 15 recommendations that were made in 2008, 10 were successful and exceeded the historical long-term market averages. We had nothing to prove yet we managed to allow these opportunities to get away from us.
On the matter of Mine Safety Appliance (MSA) there are no explanations for the reason this didn’t succeed. To think that we’d be 100% on the mark every time would be fooling ourselves. Mine Safety Appliance (MSA) was simply a bad recommendation on our part, that is, unless you bought the stock at substantially lower levels.
There are several points that must be made about our investment strategy. First, we’re trying to take responsibility for the recommendations that we make. We don’t want to make a recommendation and leave it hanging out there in the open without accountability. Too often we see Strong Buy, Buy, Accumulate, Strong Conviction, Hold, and Market Perform recommendations without the clarity that is needed for investors. Adding to the lack of clarity is the issue of the absence of sell recommendations. Our Investment and Speculation Observations are meant to alert an investor to start their own research. Our Sell recommendations are meant to alert investors that exceptional gains have been made, compared to the historical average, and that selling wouldn’t be the worst strategy. Although we issue sell recommendations, investors can clearly chose what they wish to do if they actually bought a stock that we issued an observation on.
We also want to demonstrate that what we’re doing is a matter of discipline that can be applied by anyone. We’d like to believe that what we’re doing is more than just randomness and luck. We’ll probably be proven wrong soon enough. However, until that time comes we’ll continue to gladly show our mistakes that happen to be exceptions that prove our rules.
When we make a recommendation, our goal is to buy the stock at a lower point than the recommended date. We assume that an investor or trader has to do some due diligence before deciding to invest in our recommendations. This means that if the stock ran up then don’t buy but if the stock fell since the recommendations and the fundamental attributes are intact despite the relatively low price then an acquisition of the stock might be in order.
Finally, we use the investment/speculative observation date and price as the worse case scenario for our recommendations. We hold ourselves to this as an objective measure of whether we’re making the right calls or not. If we’re right then great however, if we’re wrong then we modify the method. Since codifying our approach, as outlined in the About This Site section, we’ve had very little need to make changes. Make no mistake we’re ready and willing to change if necessary. So far we’re able to say that luck has been on our side for quite a while.
-Touc 
Email our team here.

Dow Theory

Although the markets have been relatively quiet in the last few weeks, according to Dow Theory, the Dow Jones Industrials Average and the Dow Jones Transports Average have been demonstrating classic conditions that would allow us to determine if the market will continue beyond the prior highs set in January or continue lower.
The Dow Jones Industrial Average is the measure by which everyone gauges “the market.” In the chart below, since the January 19th peak of the Industrials, the market declined until the February 8th bottom. After February 8th, the Industrials managed to exceed the rally high of 10,296.84. By exceeding the high of 10,296.84 and the 50% level of 10,368.83, the Industrials have demonstrated a bias towards going higher rather than lower.
For the Dow Jones Transportation Average, the peak of January 11th and the trough of February 8th gave us a decline of 469.97 points or 11.02%. When the index bottomed on February 8th, it was able to exceed the 3993.12 level, which is a classic Dow Theory indication that the index is going back to the old high of 4262.85. Ideally, in the chart below, if the index could stay above the 50% level (red horizontal line) and finally the 3993.12 (blue horizontal line) then we could expect the Transports to go back to the old high and possibly beyond 4262.85.
In order for Dow Theory to work, we need both the Industrials and the Transports to confirm the action of each other. So far, we’ve seen the Industrials confirm the decline started by the Transports on January 11th with a declining pattern on January 19th. After both indexes started trending downwards they both had significant rallies within the downward trend, which peaked at 10,296.84 and 3993.12. Both indexes bottomed on February 8th and moved above the rallying peaks and the 50% ranges within the previous downward trends. All of these confirming moves point to the prospect of a higher market.
The only holdout is that the Industrials went lower today (Feb. 22nd) while the Transports continued higher. From my experience, since the bottom in March 2009, I have noted that the Transports have led the way with the Industrials ultimately confirming the direction. However, this current move down, by the Industrials, while the Transports moved higher has to be taken into consideration. Any non-confirmation could lead to a major change in the trend.
The Industrials now need to stay above either the 10,368.83 or 10,296.84 while at the same time going above 10,402.34 in order to confirm the Transports’ move higher today. Alternatively, if the Industrials break down from here, falling below the 50% and rally peaks, then the Transports should follow in a similar fashion.
It should be noted that the current market action is dancing around my calculations of 10,302 being the 50% level for the Dow Industrials peak of October 2007 and the trough of March 2009 as indicated in my May 2009 posting. It is not surprising that we’re witnessing listless market action at this time. Market participants large and small are deciding if they should capitulate to the trends since March 9, 2009 or get out at a theoretical break-even point. Remember, the 50% level of the previous decline is an approximation of the average price paid by a majority of the current market participants. Is there enough momentum to keep the market going higher? Since March 9, 2009 the Transports have told us the answer to this question. We’ll have to see if this continues to be the case going forward.
-Touc