
Members
-
Topics
Archives
-
-
Recent Posts
-
-
-
Investor Education
Market Return After Exceptional Years
Dollar Cost Averaging Tool
Dow Theory: The Formation of a Line
Dividend Capture Strategy Analysis
Golden Cross – How Golden Is It?
Debunked – Death Cross
Work Smart, Not Hard
Charles H. Dow, Father of Value Investing
It's All About the Dividends
Dow Theory: Buying in Scales
How to Avoid Losses
When Dividends are Canceled
Cyclical and Secular Markets
Inflation Proof Myth
What is Fair Value?
Issues with P-E Ratios
Beware of Gold Dividends
Gold Standard Myth
Lagging Gold Stocks?
No Sophisticated Investors
Dollar down, Gold up?
Problems with Market Share
Aim for Annualized Returns
Anatomy of Bear Market Trade
Don’t Use Stop Orders
How to Value Earnings
Low Yields, Big Gains
Set Limits, Gain More
Ex-Dividend Dates -
-
Historical Data
1290-1950: Price Index
1670-2012: Inflation Rate
1790-1947: Wholesale Price Cycle
1795-1973: Real Estate Cycle
1800-1965: U.S. Yields
1834-1928: U.S. Stock Index
1835-2019: Booms and Busts
1846-1895: Gold/Silver Value
1853-2019: Recession/Depression Index
1860-1907: Most Active Stock Average
1870-2033: Real Estate Cycles
1871-2020: Market Dividend Yield
1875-1940: St. Louis Rents
1876-1934: Credit-New Dwellings
1896-1925: Inflation-Stocks
1897-2019: Sentiment Index
1900-1903: Dow Theory
1900-1923: Cigars and Cigarettes
1900-2019: Silver/Dow Ratio
1901-2019: YoY DJIA
1903-1907: Dow Theory
1906-1932: Barron's Averages
1907-1910: Dow Theory
1910-1913: Dow Theory
1910-1936: U.S. Real Estate
1910-2016: Union Pacific Corp.
1914-2012: Fed/GDP Ratio
1919-1934: Barron's Industrial Production
1920-1940: Homestake Mining
1921-1939: US Realty
1922-1930: Discount Rate
1924-2001: Gold/Silver Stocks
1927-1937: Borden Co.
1927-1937: National Dairy Products
1927-1937: Union Carbide
1928-1943: Discount Rate
1929-1937: Monsanto Co.
1937-1969: Intelligent Investor
1939-1965: Utility Stocks v. Interest Rates
1941-1967: Texas Pacific Land
1947-1970: Inventory-Sales Ratio
1948-2019: Profits v. DJIA
1949-1970: Dow 600? SRL
1958-1976: Gold Expert
1963-1977: Farmland Values
1971-2018: Nasdaq v. Gold
1971-1974: REIT Crash
1972-1979: REIT Index Crash
1986-2018: Hang Seng Index Cycles
1986-2019: Crude Oil Cycles
1999-2017: Cell Phone Market Share
2008: Transaction History
2010-2021: Bitcoin Cycles -
Interesting Read
Inside a Moneymaking Machine Like No Other
The Fuzzy, Insane Math That's Creating So Many Billion-Dollar Tech Companies
Berkshire Hathaway Shareholder Letters
Forex Investors May Face $1 Billion Loss as Trade Site Vanishes
Why the oil price is falling
How a $600 Million Hedge Fund Disappeared
Hedge Fund Manager Who Remembers 1998 Rout Says Prepare for Pain
Swiss National Bank Starts Negative
Tice: Crash is Coming...Although
More on Edson Gould (PDF)
Schiller's CAPE ratio is wrong
Double-Digit Inflation in the 1970s (PDF)
401k Crisis
Quick Link Archive
Category Archives: Dewey
The Canadian Economy
Posted in Bloomberg Commodity Index, Canada, Charles H. Dow, commodities, Dewey, Dow Theory
Tagged members
The Hidden Story of Gold
Gold is currently languishing in a trading range between $1,366 to $1,049. This trading range is thought by many to be a pause before the eventual increase above the previous high at $1,895. After all, the price of gold had managed to decline from $1,895 to the low of $1,049.40, a drop of –44.62%. Part of the thinking of a new high in gold is predicated on the idea that we are entering a phase of rising inflation after years of decreasing inflation from the 1980 peak.
Introduction
If the thinking is that gold is on the cusp of new highs, there is one question that we need to answer. The question is, “What happens with the price of gold in the early stages of an inflation cycle?” What is amazing about this question is that in the early stages of the last inflation cycle from 1939 to 1942, gold was fixed at $35 until 1971.
Never in the history of the United States have investors seen the reaction of the price of gold to the early stages of rising interest rates. In this posting, we’ll attempt to show a reasonable benchmark for gauging what would happen if there weren’t restriction on the price of gold.
Silver is the perfect means to convey the message of what would have happened to the price of gold if it were allowed to navigate the whims of Mr. Market. While silver is more volatile than gold and prone to extremes it still tells the story of gold when gold did not have a voice.
Interest Rate and Inflation Cycle
We start with the price of silver from the peak in 1925 because, according to Dewey and Dakin's in their 1947 book Cycles: The Science of Prediction, the last peak in wholesale prices, which generally corresponds to interest rates. If you have a beat on interest rates, you can get a better sense of where we are and where we might be going as it relates to precious metals.

Remember, you don’t have to be a fan of cycle theory to appreciate the quality of analysis that reflects what has already happened from a book written in 1947. Calling the peak in 1979 and the trough at 2006, while not exact, is the best way to learn from the past. Looking at the 3-month Treasury, we can see the fulfillment of an entire cycle in rates from 1940 to 2009.

Just think, there is no official data that extends from prior to 1934 to the present. Without this important continuous information, it is difficult to find data that we can compare like-for-like stages in the cycle. However, we do have data from the price of silver in the previous cycle top to the low that corresponds to the low in interest rates and silver. This will be our introduction to the secret history of gold.
Posted in BGMI, Dakin, Dewey, gold, Interest Rate Monitor, interest rates, Silver
Stock Market and Inflation Risk
A reader of our Dow 130k article has raised an important question about the risks that the stock market faces when confronted with the prospect of rising interest rates. The reader says, in part:
“…they say that interest rates are mean reverting and based on where we are today (historically low) I would think that the betting man would bet that it can only go up from here. If that is the case, I can't see a bull market in the coming years.
“What if the scenario is that we have permanent low inflation (Secular stagnation). Productivity improvements through outsourcing and technology innovation may explain this paradigm shift.”
We don’t have much to go by other than the historical record. In this case, the historical record says the following:
-
Interest rates will go up
-
Inflation is broadly bullish for the stock market
-
the period of “low inflation” is behind us
In this article, we will examine, from a historical perspective, whether this is a new era where all of our claims are false or history will repeat.
The Nature of Market Booms and Busts
In a recent article on SeekingAlpha.com titled “The Bigger The Boom, The Bigger The Bust” by William Koldus, it was suggested that:
-
“…we have already forgotten the lessons that should have been learned in 2008.”
-
“Monetary policy makers have set the course for the next ‘Minsky Moment.’"
-
“A good dose of volatility in both the stock and bond markets would be good for all financial market participants.”
In our review of Koldus’ work, we’ll attempt to demonstrate that analysis on stock market history should not begin with evidence that is narrowly defined. Our introduction of secular trends in the market might help put current market moves into perspective. We’ll also show that the Federal Reserve might not be as powerful as some might think. Finally, we hope to demonstrate that a moving market, either up or down, is good regardless of the extent and timing.
Posted in cycle analysis, Dakin, Dewey, Federal Reserve Bank, interest rates
Real Estate: Cycle Analysis
On December 9, 2010, we wrote an article titled “Real Estate: The Verdict Is In”. At the time, we said the following:
“As we come to the close of 2010, it appears that based on the narrow scope of sources that we’ve selected, the bottom in real estate has come and gone.”
Our call of a bottom was a bold claim at the time because of the following points against a rise in real estate:
Each of the above ideas were probably legitimate on their own and in a vacuum. However, financial markets tend to discount all of the issues that are generally known. Only a “black swan” event can take away the discounting mechanism of the markets. Thankfully, it is precisely because a “black swan” can’t be predicted that makes it out of the purview of any market analysis.
Through the passage of time, we have been able to see that our guess for a bottom in the real estate cycle was fairly close, based on the indicators presented at the time. This article will review the indicators that we cited in previous works. Finally, we’ll review the real estate cycle as described by Roy Wenzlick, which is the basis for much of our projections on this topic.
The first indicator is the Housing Starts of New Privately Owned Housing Units. Since our December 2010 article, the indicator has increased +124.44%, or more than double.

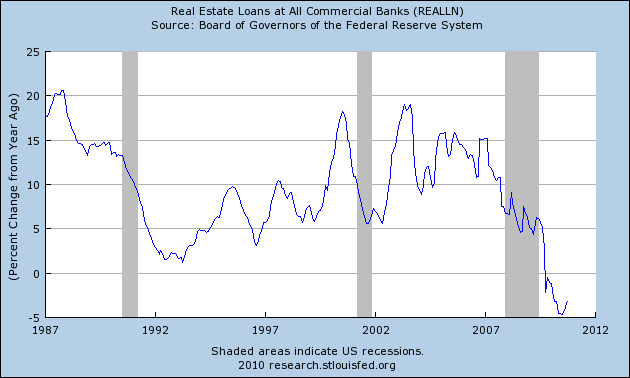
The next indicator is the Real Estate Loans at All Commercial Banks. This indicator should be clear, if banks aren’t lending then homes won’t be sold.

The next indicator plots the price of real estate for the U.S. Although there are regional differences, the general trend is the most important for assessing if a “rising tide is lifting all boats”.

Real Estate Cycle Analysis
Below we’ve included a revised and adjusted chart of Roy Wenzlick’s cycle of real estate based on the low of 2010/2011.
Posted in Black Swan, cycle analysis, Dakin, Dewey, real estate, Secular Bull Market, Wenzlick
Real Estate: The Verdict Is In
On January 6, 2010, we wrote an article titled "Real Estate Bottom is Calling". At that time we indicated that, based on the cycles as presented by Roy Wenzlick along with supporting data from the Federal Reserve Bank of St. Louis, the real estate bottom was in or that it would be registered within 2010.
As we come to the close of 2010, it appears that based on the narrow scope of sources that we’ve selected, the bottom in real estate has come and gone. Below we show a chart of housing starts which appears to have registered a bottom in the month of July 2010.

Again, the premise of our assertion that real estate would hit bottom is primarily based on the fine research of Roy Wenzlick, author of the Real Estate Analyst. Wenzlick proposed that real estate goes through 18.3 year cycles. Such cycles can be used to estimate the approximate bottoms or tops in the market for relatively accurate timing on when to buy or sell real estate.
Below is a chart that appears to show real estate hitting bottom in 1973. If we were to added 18 years to 1973 then we’d get a bottom in the real estate market in 1991. In fact, 1991 was the last major bottom in real estate. Adding 18 years to 1991 gives us an expected bottom in 2009. As stated in our article of January 6, 2010, we play it safe by including 2008 and 2010 to our expected bottom in the real estate cycle.

If we add another 18 years to the 2010 bottom that we expect that we’ve passed, we arrive at the year 2028 as the next bottom. This coincides with our inflation cycle peak that is expected from 2028 to 2030 (see right hand column). We arrived at our inflation cycle from the work of Dewey and Dakin’s book Cycles, The Science of Prediction. In their book, written in 1947, Dewey and Dakin proposed that the next peak in wholesale prices would occur in 1979 and the next trough would occur in 2006. The 1979 target was off by one year while the 2006 target is off by 2 or 3 years.
 |
| Source: Edward Dewey and Edwin Dakin. Cycles, Science of Prediction. 1947. |
Despite the discrepencies in the 2006 estimate for wholesale prices, the stage has been set for some interesting times in the coming years. Based on the indicated sources above, we feel that real estate has a six to nine year stretch of rising prices or "trading" in a range and decreased foreclosures.
Posted in Dakin, Dewey, real estate, Wenzlick