At the end of the week, our watch list ballooned to 62 companies. Here is the watch list which ranks current and former Dividend Achievers that are within 20% of the 52-week low for May 7, 2010. Stocks that appear on our watch lists are not recommendations to buy. Instead, they are the starting point for doing your research and determining the best company to buy. Ideally, a stock that is purchased from this list is done after a considerable decline in the price and extensive due diligence.
| Symbol |
Name |
Price |
% Yr Low |
P/E |
EPS |
Div/Shr |
Yield |
Payout Ratio |
| MON |
Monsanto Co. |
59.09 |
3.14% |
24.62 |
2.40 |
1.06 |
1.79% |
44% |
| HSC |
Harsco Corp. |
26.38 |
3.37% |
19.69 |
1.34 |
0.82 |
3.11% |
61% |
| FRS |
Frisch's Restaurants, Inc |
20.77 |
4.32% |
10.49 |
1.98 |
0.52 |
2.50% |
26% |
| SHEN |
Shenandoah Telecom |
16.95 |
5.28% |
26.48 |
0.64 |
0.32 |
1.89% |
50% |
| VIVO |
Meridian Bioscience Inc. |
18.29 |
5.66% |
23.15 |
0.79 |
0.76 |
4.16% |
96% |
| ADM |
Archer Daniels Midland Co. |
25.94 |
6.97% |
10.67 |
2.43 |
0.60 |
2.31% |
25% |
| HCC |
HCC Insurance Holdings, Inc. |
24.71 |
7.06% |
7.95 |
3.11 |
0.54 |
2.19% |
17% |
| DNB |
Dun & Bradstreet Corp. |
74.10 |
7.24% |
14.88 |
4.98 |
1.40 |
1.89% |
28% |
| THFF |
First Financial Corp. Indiana |
27.19 |
7.34% |
15.72 |
1.73 |
0.90 |
3.31% |
52% |
| LLY |
Lilly (Eli) & Co. |
34.62 |
7.55% |
8.92 |
3.88 |
1.96 |
5.66% |
51% |
| OTTR |
Otter Tail Corp. |
20.10 |
7.89% |
28.31 |
0.71 |
1.19 |
5.92% |
168% |
| T |
AT&T Inc |
25.10 |
8.24% |
12.49 |
2.01 |
1.68 |
6.69% |
84% |
| CWT |
California Water Service Group |
36.26 |
8.27% |
18.79 |
1.93 |
1.19 |
3.28% |
62% |
| VVC |
Vectren Corp. |
23.25 |
8.70% |
14.18 |
1.64 |
1.36 |
5.85% |
83% |
| FII |
Federated Investors Inc |
23.53 |
8.94% |
12.01 |
1.96 |
0.96 |
4.08% |
49% |
| XOM |
Exxon Mobil Corp. |
63.70 |
8.96% |
14.51 |
4.39 |
1.76 |
2.76% |
40% |
| NWN |
Northwest Natural Gas Co. |
43.50 |
9.77% |
15.37 |
2.83 |
1.66 |
3.82% |
59% |
| WEYS |
Weyco Group, Inc. |
22.87 |
9.85% |
20.60 |
1.11 |
0.64 |
2.80% |
58% |
| SVU |
SUPERVALU INC |
13.40 |
10.47% |
7.24 |
1.85 |
0.35 |
2.61% |
19% |
| WMT |
Wal-Mart Stores, Inc. |
52.40 |
10.67% |
14.16 |
3.70 |
1.21 |
2.31% |
33% |
| FFIN |
First Financial Bankshares, Inc. |
51.44 |
10.72% |
19.94 |
2.58 |
1.36 |
2.64% |
53% |
| CTWS |
Connecticut Water Service, Inc. |
21.39 |
10.77% |
17.97 |
1.19 |
0.91 |
4.25% |
76% |
| NTRS |
Northern Trust Corp. |
51.80 |
10.87% |
16.29 |
3.18 |
1.12 |
2.16% |
35% |
| MDU |
MDU Resources Group Inc. |
18.47 |
10.93% |
13.10 |
1.41 |
0.63 |
3.41% |
45% |
| UHT |
Universal Health Realty Income |
32.30 |
11.03% |
20.84 |
1.55 |
2.40 |
7.43% |
155% |
| UMBF |
UMB Financial Corp. |
40.36 |
11.06% |
17.47 |
2.31 |
0.74 |
1.83% |
32% |
| TMP |
Tompkins Financial Corp. |
38.60 |
11.41% |
12.78 |
3.02 |
1.36 |
3.52% |
45% |
| GS* |
Goldman Sachs Group, Inc. |
142.99 |
11.66% |
5.96 |
24.01 |
1.40 |
0.98% |
6% |
| WTR |
Aqua America Inc |
17.39 |
13.00% |
22.58 |
0.77 |
0.58 |
3.34% |
75% |
| SPH |
Suburban Propane Partners L.P. |
44.10 |
13.08% |
11.28 |
3.91 |
3.36 |
7.62% |
86% |
| FPL |
FPL Group, Inc. |
51.22 |
13.09% |
11.59 |
4.42 |
2.00 |
3.90% |
45% |
| AROW |
Arrow Financial Corp. |
25.96 |
13.20% |
13.88 |
1.87 |
1.00 |
3.85% |
53% |
| STT |
State Street Corp. |
41.34 |
13.73% |
-10.08 |
-4.10 |
0.04 |
0.10% |
-1% |
| ABT |
Abbott Laboratories |
48.72 |
13.96% |
14.29 |
3.41 |
1.76 |
3.61% |
52% |
| BXS |
BanCorp.South Inc. |
20.19 |
15.04% |
27.28 |
0.74 |
0.88 |
4.36% |
119% |
| PGN |
Progress Energy, Inc. |
38.83 |
15.05% |
14.33 |
2.71 |
2.48 |
6.39% |
92% |
| PBI |
Pitney Bowes Inc |
23.53 |
15.46% |
12.26 |
1.92 |
1.46 |
6.20% |
76% |
| NJR |
New Jersey Resources Corp. |
35.76 |
15.54% |
29.80 |
1.20 |
1.36 |
3.80% |
113% |
| BEC |
Beckman Coulter, Inc. |
60.12 |
15.99% |
25.15 |
2.39 |
0.72 |
1.20% |
30% |
| SYBT |
S.Y. BanCorp., Inc. |
22.98 |
16.06% |
18.99 |
1.21 |
0.68 |
2.96% |
56% |
| TR |
Tootsie Roll Industries Inc |
25.42 |
16.45% |
27.33 |
0.93 |
0.32 |
1.26% |
34% |
| BRO |
Brown & Brown, Inc. |
19.01 |
16.48% |
18.10 |
1.05 |
0.31 |
1.63% |
30% |
| ATO |
Atmos Energy Corp. |
27.33 |
16.60% |
12.15 |
2.25 |
1.34 |
4.90% |
60% |
| AWR |
American States Water Co. |
36.12 |
17.20% |
22.30 |
1.62 |
1.04 |
2.88% |
64% |
| NUE |
Nucor Corp. |
44.90 |
17.32% |
-187.08 |
-0.24 |
1.44 |
3.21% |
-600% |
| PX |
Praxair, Inc. |
78.88 |
17.40% |
19.29 |
4.09 |
1.80 |
2.28% |
44% |
| SFNC |
Simmons First National Corp. |
28.07 |
17.45% |
17.12 |
1.64 |
0.76 |
2.71% |
46% |
| BMI |
Badger Meter, Inc. |
38.41 |
17.89% |
17.70 |
2.17 |
0.48 |
1.25% |
22% |
| HGIC |
Harleysville Group Inc. |
30.76 |
17.90% |
11.19 |
2.75 |
1.30 |
4.23% |
47% |
| MATW |
Matthews International Corp. |
32.51 |
18.13% |
15.71 |
2.07 |
0.28 |
0.86% |
14% |
| JNJ |
Johnson & Johnson |
63.31 |
18.25% |
13.30 |
4.76 |
2.16 |
3.41% |
45% |
| SBSI |
Southside Bancshares, Inc. |
20.61 |
18.51% |
7.75 |
2.66 |
0.65 |
3.15% |
24% |
| PFE |
Pfizer Inc |
16.46 |
18.84% |
13.38 |
1.23 |
0.72 |
4.37% |
59% |
| APD |
Air Products & Chemicals, Inc. |
70.98 |
19.09% |
17.79 |
3.99 |
1.96 |
2.76% |
49% |
| DBD |
Diebold, Inc. |
28.92 |
19.26% |
40.17 |
0.72 |
1.08 |
3.73% |
150% |
| MLM |
Martin Marietta Materials, Inc. |
88.14 |
19.46% |
46.15 |
1.91 |
1.60 |
1.82% |
84% |
| UGI |
UGI Corp. |
26.47 |
19.72% |
12.09 |
2.19 |
0.80 |
3.02% |
37% |
| BCR |
CR Bard, Inc. |
82.97 |
19.83% |
17.54 |
4.73 |
0.68 |
0.82% |
14% |
| CTAS |
Cintas Corp. |
25.54 |
19.91% |
23.87 |
1.07 |
0.48 |
1.88% |
45% |
| MGEE |
MGE Energy Inc. |
35.32 |
20.05% |
15.98 |
2.21 |
1.47 |
4.16% |
67% |
| BMS |
Bemis Co Inc |
27.70 |
20.28% |
21.47 |
1.29 |
0.92 |
3.32% |
71% |
| WGL |
WGL Holdings, Inc. |
34.44 |
20.46% |
15.31 |
2.25 |
1.51 |
4.38% |
67% |
| 62 Companies |
|
|
|
|
|
|
|
*Goldman Sachs isn't a former or current dividend achiever but I feel that it is worth watching because it could be the proxy of our financial system.
Watch List Summary
The best performing stock from last week's list was Simmons First National (SFNC) which was at break-even. The worst performing stock was Harsco (HSC) which fell 14.8%. Overall, the Dividend Achiever watch list lost 4.9% versus the Dow which was down 5.7%.
Never before have we seen this many companies on our watch list. Part of the reason could be because the 52-week time frame now ranges from May 2009 to May 2010. You may remember that when the market bottomed in March 2009, I suggest that investors look at the company's performance at its worse possible level, which in many cases was the March 2009 low.
Use this list to your advantage. There are (and will be) great companies paying nice dividends with low payout ratios. Place these companies in your own watch list so that when opportunities arise, you can purchase them with a greater margin of safety.
Market Commentary
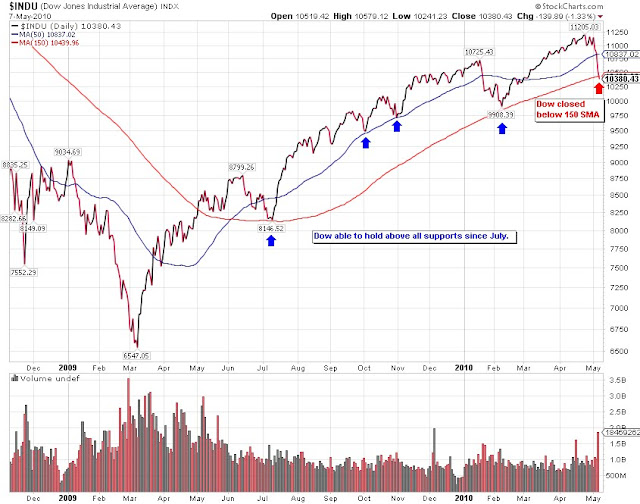
As you may have noticed from our watch list, the market took a turn similar to what happened in January when the Dow retraced about 7% from the peak. At the close of Friday at 10,380, we've pulled back 7% from the closing high. It is interesting to note that in January, the Greek tragedy was already known so this shouldn't have surprised us. Our only concern at this point is, will the Dow fail to hold above the 150-day moving average which has been a strong support level for the market since July. (see chart below)
After seeing what took place on Thursday, I have increased my requirement for a margin of safety in new investment stakes. For example, I may look at companies that are within 15% of a new low instead of 20%. In considering companies to buy or sell, I would aim for a deeper discount (lower price) if I plan to buy and take smaller "fair profits" if I plan to sell. Remember, the market isn't cheap by any standard. With the latest figures I calculated, based on the Friday close, the Dow is now trading at 15x trailing earnings and 11x forward earnings. This assume 36% earning growth for the Dow. On a yield basis, the Dow is trading at 2.76%. Using the Thursday low, the yield was close to 3%. - Art


Dividend Achiever Watch List
*Goldman Sachs isn't a former or current dividend achiever but I feel that it is worth watching because it could be the proxy of our financial system.
Watch List Summary
1 Comment
Posted in Commentary, Dividend Achiever Watch List
Tagged members