Category Archives: Cephalon Inc.

Nasdaq 100 Watch List: March 16, 2012

Below are the Nasdaq 100 companies that are within 20% of their respective 52-week lows. This Nasdaq 100 Watch List is strictly for the purpose of researching whether or not the companies have viable business models or are about to go out of business. These companies are deemed highly speculative unless otherwise noted.

Symbol Name Price P/E EPS Yield Price/Book payout % from Low
CHRW C.H. Robinson Worldwide 65.67 25.06 2.62 2.00 8.55 50.38% 5.41%
VOD Vodafone Group Plc 26.41 12.28 2.15 3.60 1.02 44.19% 8.64%
EA Electronic Arts Inc. 17.46 0 -0.52 0.00 2.45 0.00% 8.79%
CTRP Ctrip.com Int'l 24.68 22.09 1.12 0.00 3.03 0.00% 12.08%
APOL Apollo Group 42.59 12.08 3.53 0.00 4.07 0.00% 14.86%
FSLR First Solar 29.08 0 -0.46 0.00 0.66 0.00% 14.99%
AMZN Amazon.com 185.05 135.07 1.37 0.00 10.82 0.00% 15.07%
RIMM Research In Motion 14.38 3.39 4.25 0.00 0.68 0.00% 15.50%
VMED Virgin Media Inc. 24.18 65.18 0.37 0.70 7 43.24% 17.84%
SRCL Stericycle, Inc. 86.88 32.3 2.69 0.00 6.11 0.00% 18.93%
DTV DIRECTV 47.47 13.68 3.47 0.00 -10.53 0.00% 19.21%
EXPD Expeditors Int'l of Wash 45.81 25.59 1.79 1.10 4.71 27.93% 19.76%

Watch List Summary

A company that we’re considering buying is C.H. Robinson Worldwide (CHRW), the first company on our list.  The primary consideration that we have is always the downside risk.  We almost ignore the upside targets and projections in order to come up with an idea on the best ways to avoid loss.

The following are two perspectives on the way to view the potential downside risk of buying CHRW. First, according to Dow Theory, CHRW has three significant downside targets that should be considered carefully. The three downside targets are as follows:

  • $60.34 (fair value)
  • $52.91
  • $38.06

The way we approach the Dow Theory downside targets is to buy CHRW if it falls to $60.34 (fair value according to Dow Theory). However, we prepare ourselves for the worst case scenario by expecting that CHRW will decline to the $38.06 level, the low for 2009. With this assumption, we ensure that our initial purchase does not include 100% of what we'd normally invest. Instead, we only invest 30%, 50% or 65% of the amount that we'd ordinarily invest. The remainder of funds is set aside for the possibility that the stock declines. Naturally the greater the amount invested initially, the greater the loss or gain if the stock declines or rises.

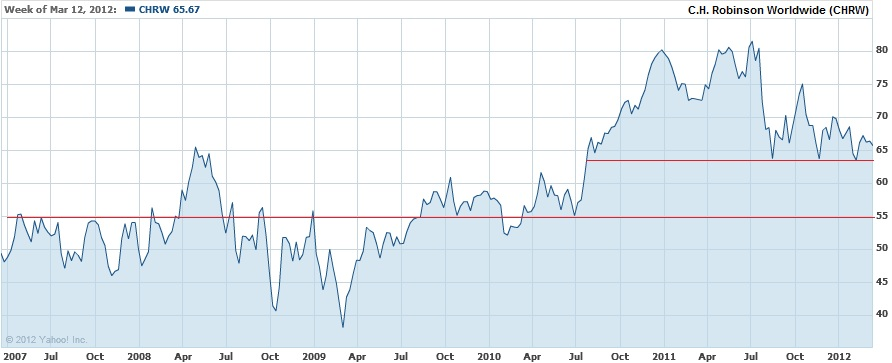
The second way to view CHRW's downside risk is strictly from the "technical" patterns based on a chart from the last 5 years.
3-16-2012

From a "technical" standpoint, there are significant support levels at $63.50, $55 and $38. These technical levels are not very different from Dow Theory even though the technical levels based on the chart above are strictly based on the visual cues. We specifically chose the last 5 years because Charles H. Dow has said that best way to gauge a company's future prospects is usually through careful consideration of the period when earnings, book value, price and other fundamental attributes are at their worst. For us, the inclusion of 2007 to 2009 is the best reflection of the worst that has been experienced recently.  With either approach to reviewing the downside risk of a stock, the purpose is ensure that you do not get caught off guard at the prospect of a major price decline.

Watch List Performance Review

In our ongoing review of the Nasdaq 100 Watch List, we have taken the topic 5 stocks from our March 6, 2011 Nasdaq 100 Watch List.   The top 5 companies from the watch list are provided below with the closing price from March 7, 2011 to March 6, 2012.

Symbol Company 2011 2012 % Change
CSCO Cisco Systems, Inc. $18.40 $20.03 8.86%
CEPH Cephalon, Inc. $56.17 $81.49 45.08%
AMGN Amgen Inc. $52.32 $67.38 28.78%
TEVA Teva Pharmaceutical Industries  $50.32 $43.08 -14.39%
ATVI Activision Blizzard, Inc $11.27 $12.65 12.24%
Average 16.12%
NDX Nasdaq 100 $2,328.07 $2,712.78 16.52%

3-6-2011 Top 5

Our primary goal at the New Low Observer is to achieve 10% gains within the span of a year inside of our tax deferred accounts.  In the case of AMGN, CEPH and ATVI our goal of 10% within a year was accomplished within the first four months.  CSCO was the last 10% gain that arrived at the end of the 1-year period.  Teva Pharmaceutical (TEVA) severely underperformed for the remainder of the 1-year period.  CEPH did not last very long since it was acquired by none other than Teva Pharmaceutical.  Cephalon was acquired by TEVA within two months of being on our watch list.

Our specific recommendation of Cephalon at $58.99 on February 15, 2011 and the subsequent acquisition explains why we’re drawn to companies at a new low.

Teva Pharmaceuticals (TEVA) Now Slated to Acquire Cephalon (CEPH)

The plot thickens with news that Teva Pharmaceuticals (TEVA) is going to buy Cephalon (CEPH) for $81.50 (article here).  Teva’s offer exceeds Valeant Pharmaceuticals’ (VRX) previous bid of $73. 

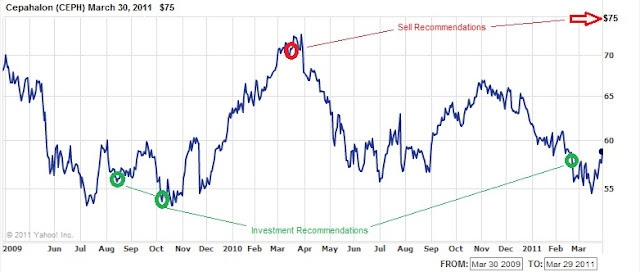
We originally recommended Cephalon (CEPH) in August of 2009.  After our August 2009 recommendation of Cephalon, we recommended selling the stock near the high of $71 in March 2010 before the decline to $56.  In February 2011 we recommended readers consider Cephalon at the $58 level.  From there the stock has appreciated 39% in less than 3 months.  The most recent run of Cephalon was followed by a sell recommendation on March 30, 2011 at slightly above $75.  We wagered that despite the prospect of getting a sweetened offer closer to the true value of the company, we didn’t need to argue with a nearly 200% annualized return.

Our recent recommendation of Teva Pharmaceuticals (TEVA) on April 5, 2011 puts a twist on our selling of Cephalon.  It has been reported that Cephalon’s board rejected the Valeant offer and has already accepted the Teva offer. 

Interestingly, both Teva Pharmaceuticals and Valeant Pharmaceuticals got a boost in their share price at the announcement of the acquisition of Cephalon.  Typically, the acquiring company shares would decline at the announcement of a major purchase.  This seems to indicates that the market recognizes the positive impact that Cephalon will have on the ultimate acquirer.

Investors seeking the qualitative elements of Cephalon but cannot justify the purchase at the current price can hedge their bets by buying Teva at the current undervalued levels and gain the growth prospects clout of both companies. Obviously, this assumes that the deal goes through between TEVA and CEPH. If the deal with Teva and Cephalon doesn’t go through, we still believe that Teva represents a solid value at the current price. 


Please revisit New Low Observer for edits and revisions to this post. Email us.

Sell Cephalon (CEPH) at the Market

Our premise that exceptional values starts with quality companies trading near a 52-week low has been proven again. Just like our calls on Beckman Coulter (BEC), Wesco Financial (WSC), Genzyme (GENZ) and many others, our articles on Cephalon (CEPH) have shown that quality cannot be ignored.
In a series of articles starting in August of 2009, we recommended considering the purchase of CEPH at $56.61. Subsequently, in March 2010, we recommended selling CEPH at around the $71 price range, which was two dollars short of the high at $73. Finally, on February 11, 2011, we recommended that followers of this site reconsider CEPH at $58.99. Soon after our recommendation, CEPH declined to the most recent low of $57. A month and a half later, Cephalon (CEPH) is getting a hostile bid from Valeant Pharmaceuticals (VRX) for approximately $73 a share.
Although our cursory examination of the offer by VRX seems generous, we believe that CEPH probably should, and could, be worth closer to $115 rather than $73. Regardless of this concern, we believe that 23% in 46 days affords us the opportunity to recommend selling the stock at the current price. There are too many opportunities on our Nasdaq 100 and Dividend Watch Lists. Based on our last recommendation, the annualized return on this position would be close to 200% in a tax-deferred account.
Please revisit New Low Observer for edits and revisions to this post. Email us.

Speculation Observation: Cephalon at $58.99

Lately, in the pharmaceutical industry, it seems that you just can’t win. The big pharma companies are being thrown under the bus because of patent expirations, diminished pipelines and lawsuits. On the horizon are the firms most likely to be considered the next big pharma with a pipeline of products but also facing patent expirations and lawsuits.
In the case of Cephalon (CEPH), it couldn’t catch a break if it was handed to them. On Friday February 11, 2011, Barron’s came out with an analyst report (article here) that downgraded Cephalon from “Average” to “Below Average” with a price target of $54. Considering that Cephalon was already selling within 8.5% of the 52-week low at the time the article was published, we’re not sure if Caris & Co. meant to avoid giving a sell recommendation or not.
The problem with Cephalon, according to research firm Caris & Co., is that the late stage pipeline of products coming due may not boost revenue if sales of recently introduced Nuvigil are any indication. Combined with the fact that Provigil, which contributes 50% to Cephalon’s revenue stream, is due to face patent expiration in April of 2012 and we’ve got a recipe for disaster. Caris & Co also feels that the three pipeline drugs (Lupuzor, Cinquil and CEP-33237) hold no promise for either treatment or commercial value.  Adding to the caustic mix of diminishing sales from existing products and sub par pipeline are two court cases (Fentora and Amrix) which are likely not to go Cephalon’s way.
Not to be outdone, on February 15, 2011, a Jefferies & Co. analyst downgraded Cephalon to “Underperform” from “Buy”(article here). With the current price of CEPH going for around $58, it was shocking that the Jefferies analyst didn’t indicate that the stock should be sold considering that he (Corey Davis) has a target price of $48 instead of the previous price of $77.
If Mr. Davis feels so confident that CEPH is really worth 17% less than the current price why would it merely “underperfom” one day when only the day before it was indicated to possibly rise by 32%. With a spread of 60% in his change of opinion, it becomes challenging to believe Mr. Davis isn’t parroting the downgrade given by Caris & Co. that had such a large impact on stock price on February 11th.
Although we know how hard it is for some research and investment firms to actually say sell, the timing of these calls couldn’t be more poorly selected. Even if the stock were to accomplish the $48 level, it is too little too late. Investors needed to know that at $72 (52-week high) the stock was overpriced. Telling us that things won’t go well now is a slap in the face to some who possibly bought the stock at much higher levels. Our sell recommendation of Cephalon at $71 in early March 2010 (article here) was only rivaled by our initial speculative observation at $57 in late August 2009 (article here).
Since Cephalon is so close to the low and the negativity is running so high, we decided to run some numbers to see what the worst case scenario could be if the company were to actually survive (by the way, we think it will.)
According to Value Line dated January 14, 2011, the book value for Cephalon in 2009 was $30.19. Prior to the recession that began in 2007, Cephalon had its lowest price-to-book (P/B) ratio at 2.66 back in 2003. At that time, Cephalon had a price-to-earnings (P/E) ratio of 23.
Currently, Cephalon is selling for 11 times earnings and if the stock price were to match the P/B of 2003 then CEPH would be selling for $80. If we assume that Cephalon can only accomplish half of the $80 target, then the stock should rise to $69 or 19% above the current level.
On a cash flow basis, Value Line estimated the cash flow for 2010 to be $8.55 per share. Based on the average low price-to-cash flow (P/CF) over the last three years, the stock should be trading at $67.29. If considered on the lowest level of the high range in the P/CF over the last three years, CEPH would be selling for $72.85. The last 3 years are utterly the lowest on a relative basis making comparisons over this period the most conservative possible.
All of the scenarios indicated above assume that Cephalon doesn’t find a way to increase their earnings going forward. Since the big name analysts are in agreement that this company is dead on arrival, we feel this company is worth a balanced second opinion. If for some reason the analysts are right about this company, then the downside target or downside risk is that the stock would fall to $51.63. However, considering the speculative nature of this selection (as with all Nasdaq 100 stocks) we prefer that CEPH occupy only a small portion of the portfolio while accepting at least 50% losses.

Article Links:


Please revisit New Low Observer for edits and revisions to this post. Email us.

Speculative Observation: Cephalon Inc. (CEPH) at $62.42

The new year brings new challenges and opportunities. The first opportunity for this year may come from Cephalon (CEPH) which engages in the discovery, development, and commercialization of products for central nervous system, inflammatory disease, pain, and oncology therapeutic areas. It competes against GlaxoSmithKline plc (GSK), Johnson & Johnson (JNJ), and Sepracor Inc. Because the company doesn't pay a dividend, the New Low Observer team has to classify such a security as a speculation.

CEPH came onto our radar when we began compiling the new low data back in July when the stock was trading around $57. This was 8% above the 52 week low of $52.55. At the low, CEPH was trading at less than 15 times earnings. Although appearing to be risky, selected stocks at or near their low offer investors the opportunity to investigate quality companies for potential price increases. Our concept is laid out in the "Buy Low, Sell High" article.

CEPH has a market cap of $4.6 billion dollar. The relatively small size compared to its rivals doesn't discourage us. We only care about the market cap as a means for liquidity when buying and selling the stock. CEPH earned $3.62 per share over the last 12 months and thus has a price to earnings ratio (P/E) of 17 and a forward P/E of 10, an extraordinarily low multiple. Low P/E multiples imply that investors are paying less for every dollar of earnings (more on our view of P/E). CEPH has a book value of $28.71 per share. At $62, price-to-book is north of 2. A positive operating cash flow of $232.48M is a plus but a negative free cash flow is one of my concern ($-12.71M).

Fundamentals aside, the stock may have discounted all the negative news based on the chart pattern. In 2009, Cephalon dropped 19% as opposed to the Dow Industrials which rose 19%. Unlike the Dow which hit the yearly low in March, Cephalon bottomed in July and formed what appears to be a base. This pattern is prominent because it shows that the stock failed to move either up or down and traded in range between $60 and $53. Any break above $60 or below $53 will reveal its potential direction of the stock. Sure enough, the stock broke above $60 in late December and will look for that to be a support for the stock. The momentum indication also turned bullish as the 50-day moving average crossed the upward sloping 150-day moving average as indicated in the chart below.

Another indicator I like to refer to is the Coppock Curve (click here for more on the Coppock Curve). For Cephalon, the curve dates back to 1993. The table below shows my findings.

Date Price 3 Mo After % Change
May-95 9.81 24.25 147%
Feb-98 12.00 10.63 -11%
Sep-98 7.31 9.00 23%
Mar-99 8.75 17.38 99%
May-03 45.16 44.35 -2%
Sep-05 46.42 64.74 39%
Aug-08 76.62 73.48 -4%

The average percentage gain if you sell three months after the buy indication is 42%. Excluding the 1995 data, it is 24%. We are waiting for the indicator to turn for a possible buy signal.

A buy strategy would be to purchase this stock as close as possible to $60 or the 50 day moving average which is dynamic and constantly changing. Use the Coppock indicator as another gauge to buy and watch your gains or losses closely. - Art

A Second Look at Cephalon Inc. (CEPH)

Speculative Observation
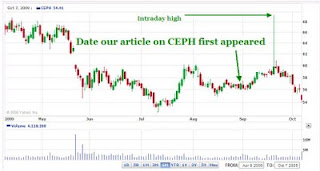
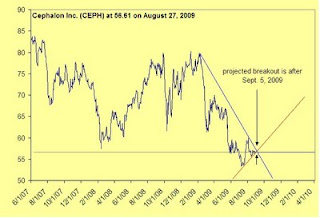
It is just our luck that Cephalon Inc. (CEPH) did exactly what we thought would happened based on the chart pattern in our August 27, 2009 article. In that posting, we said that we thought that Cephalon would experience a price breakout starting on the September 5th. The bias that we had in the article was clearly in favor of a stock price rise in the breakout formation. Part of our justification for this was due in part, on the fact that CEPH was, according to our metrics, relatively undervalued. However, we didn't know when and by how much the stock would rise.

On September 21st, Cephalon rose to an intraday high of $69.30, far exceeding our expectations for the stock in the short term. Because this stock does not pay a dividend we could not make a recommendation of this company as an investment observation. It appears that the speculative observation that we gave was appropriate for the recent moves in the price. However, the stock is now approaching the 52-week low again.
Below are the revised figures for the Dow Theory downside targets (since the upside takes care of itself):
  • $40
  • $31.66
  • $14.40
  • $6

For the reasons above, we highly recommend that you re-consider the article written on August 27th. With a $4 billion market cap, this stock should be among your choices of new speculative opportunities. Art and Touc.

Cephalon Inc. (CEPH) at $56.61

Speculation Observation

Cephalon Inc. (CEPH), according to Yahoo!Finance is, "a biopharmaceutical company, engages in the discovery, development, and commercialization of products for central nervous system, inflammatory disease, pain, and oncology therapeutic areas."

The earnings history of this company is a train wreck filled with inconsistency. This, more than anything else, makes CEPH highly speculative. It seems that this company is still on the borderline of being an upstart biotech company and a major drug manufacturer. I don't understand how Valueline and Morningstar could attach such high expectations as $170 and $140 on the upper end.

This company is within 7.73% of the one year low. This situation may have many reasons why it is trading so close to the low however the technical pattern for this stock is very interesting. As indicated in the chart below, we see that CEPH has an upside down head-and-shoulder formation. In addition, the stock has an ascending low price (red line) that is about to converge with the descending high price (blue line.)

For whatever reason, this stock has the ability to make wide swings up and down within an overall declining trend of the market.

According to Dow Theory, this stock has the following downside targets:
  • $54.20
  • $14.40
  • $4.00
The fact that the stock hit a low of $52.55 recently and turned up could indicate that this stock has seen its bottom.

According to Value Line Investment Survey, CEPH has an average price to cash flow ratio of 14. After adjusting the price/cash flow downward from 95 million to 78 million diluted shares I got an average price of $66.92. This means that the stock is theoretically trading 18% below the average historical price.

However, if we don't adjust for the increase in shares from 78 million to 95 million then we get historical price of $81.62, a 44% difference from the historical average price. We always want to assume the worst in this scenario so we're going with the 18%.

Please check the fundamentals for this company to verify that you've got the guts to hold on to this stock were it to fall to the $39.80 level or lower. Good luck in your research of this company and remember that CEPH is highly speculative.

Art and Touc