Below are the Nasdaq 100 companies that are within 20% of their respective 52-week lows. This Nasdaq 100 Watch List is strictly for the purpose of researching whether or not the companies have viable business models or are about to go out of business. These companies are deemed highly speculative unless otherwise noted.
| Symbol | Name | Price | P/E | EPS | Yield | Price/Book | payout | % from Low |
| CHRW | C.H. Robinson Worldwide | 65.67 | 25.06 | 2.62 | 2.00 | 8.55 | 50.38% | 5.41% |
| VOD | Vodafone Group Plc | 26.41 | 12.28 | 2.15 | 3.60 | 1.02 | 44.19% | 8.64% |
| EA | Electronic Arts Inc. | 17.46 | 0 | -0.52 | 0.00 | 2.45 | 0.00% | 8.79% |
| CTRP | Ctrip.com Int'l | 24.68 | 22.09 | 1.12 | 0.00 | 3.03 | 0.00% | 12.08% |
| APOL | Apollo Group | 42.59 | 12.08 | 3.53 | 0.00 | 4.07 | 0.00% | 14.86% |
| FSLR | First Solar | 29.08 | 0 | -0.46 | 0.00 | 0.66 | 0.00% | 14.99% |
| AMZN | Amazon.com | 185.05 | 135.07 | 1.37 | 0.00 | 10.82 | 0.00% | 15.07% |
| RIMM | Research In Motion | 14.38 | 3.39 | 4.25 | 0.00 | 0.68 | 0.00% | 15.50% |
| VMED | Virgin Media Inc. | 24.18 | 65.18 | 0.37 | 0.70 | 7 | 43.24% | 17.84% |
| SRCL | Stericycle, Inc. | 86.88 | 32.3 | 2.69 | 0.00 | 6.11 | 0.00% | 18.93% |
| DTV | DIRECTV | 47.47 | 13.68 | 3.47 | 0.00 | -10.53 | 0.00% | 19.21% |
| EXPD | Expeditors Int'l of Wash | 45.81 | 25.59 | 1.79 | 1.10 | 4.71 | 27.93% | 19.76% |
Watch List Summary
A company that we’re considering buying is C.H. Robinson Worldwide (CHRW), the first company on our list. The primary consideration that we have is always the downside risk. We almost ignore the upside targets and projections in order to come up with an idea on the best ways to avoid loss.
The following are two perspectives on the way to view the potential downside risk of buying CHRW. First, according to Dow Theory, CHRW has three significant downside targets that should be considered carefully. The three downside targets are as follows:
- $60.34 (fair value)
- $52.91
- $38.06
The way we approach the Dow Theory downside targets is to buy CHRW if it falls to $60.34 (fair value according to Dow Theory). However, we prepare ourselves for the worst case scenario by expecting that CHRW will decline to the $38.06 level, the low for 2009. With this assumption, we ensure that our initial purchase does not include 100% of what we'd normally invest. Instead, we only invest 30%, 50% or 65% of the amount that we'd ordinarily invest. The remainder of funds is set aside for the possibility that the stock declines. Naturally the greater the amount invested initially, the greater the loss or gain if the stock declines or rises.
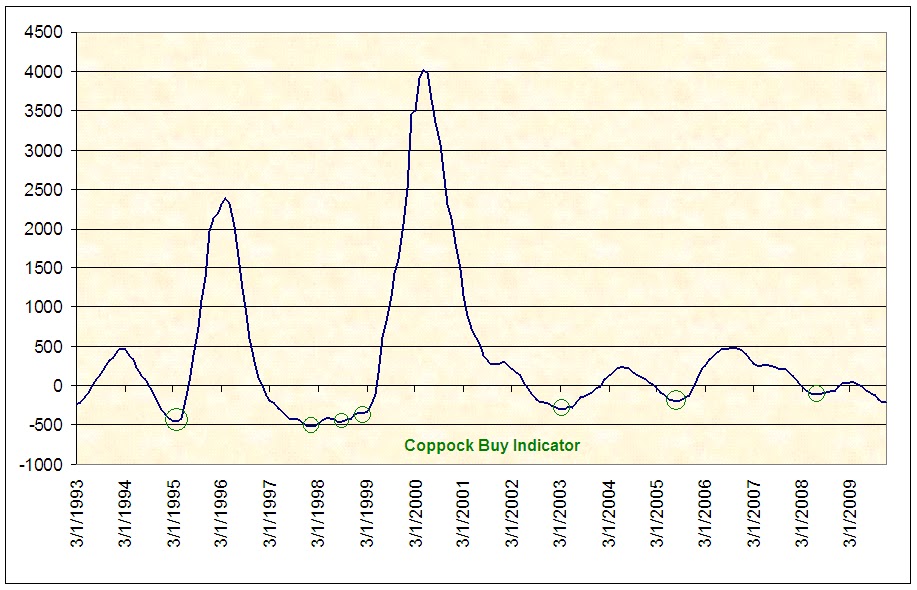
The second way to view CHRW's downside risk is strictly from the "technical" patterns based on a chart from the last 5 years.

From a "technical" standpoint, there are significant support levels at $63.50, $55 and $38. These technical levels are not very different from Dow Theory even though the technical levels based on the chart above are strictly based on the visual cues. We specifically chose the last 5 years because Charles H. Dow has said that best way to gauge a company's future prospects is usually through careful consideration of the period when earnings, book value, price and other fundamental attributes are at their worst. For us, the inclusion of 2007 to 2009 is the best reflection of the worst that has been experienced recently. With either approach to reviewing the downside risk of a stock, the purpose is ensure that you do not get caught off guard at the prospect of a major price decline.
Watch List Performance Review
In our ongoing review of the Nasdaq 100 Watch List, we have taken the topic 5 stocks from our March 6, 2011 Nasdaq 100 Watch List. The top 5 companies from the watch list are provided below with the closing price from March 7, 2011 to March 6, 2012.
| Symbol | Company | 2011 | 2012 | % Change |
| CSCO | Cisco Systems, Inc. | $18.40 | $20.03 | 8.86% |
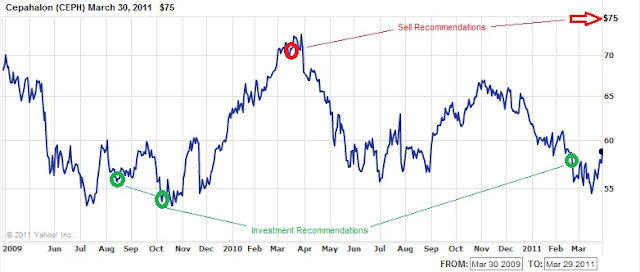
| CEPH | Cephalon, Inc. | $56.17 | $81.49 | 45.08% |
| AMGN | Amgen Inc. | $52.32 | $67.38 | 28.78% |
| TEVA | Teva Pharmaceutical Industries | $50.32 | $43.08 | -14.39% |
| ATVI | Activision Blizzard, Inc | $11.27 | $12.65 | 12.24% |
| Average | 16.12% | |||
| NDX | Nasdaq 100 | $2,328.07 | $2,712.78 | 16.52% |

Our primary goal at the New Low Observer is to achieve 10% gains within the span of a year inside of our tax deferred accounts. In the case of AMGN, CEPH and ATVI our goal of 10% within a year was accomplished within the first four months. CSCO was the last 10% gain that arrived at the end of the 1-year period. Teva Pharmaceutical (TEVA) severely underperformed for the remainder of the 1-year period. CEPH did not last very long since it was acquired by none other than Teva Pharmaceutical. Cephalon was acquired by TEVA within two months of being on our watch list.
Our specific recommendation of Cephalon at $58.99 on February 15, 2011 and the subsequent acquisition explains why we’re drawn to companies at a new low.