Below is a chart of Activision Blizzard (ATVI) from 2003 to 2021, reflecting Price Momentum data.

Below is a chart of Activision Blizzard (ATVI) from 2003 to 2021, reflecting Price Momentum data.
Posted in atvi, Price Momentum
Review
The following is the pattern of price appreciation and decline for Activision Blizzard (ATVI) from 1993 to 2017 with the application of Speed Resistance Lines [SRL].
1993 to 1996

In the period from 1993 to 1996, we can see that Activision Blizzard (ATVI) increase from $0.27 to as high as $1.50 or a gain of +455%. The decline that followed saw ATVI fall –58%, achieving the conservative downside target of $0.80 and the mid range downside target of $0.65. Although the chart doesn’t show it, ATVI did not rises above the 1995 level and subsequently fell as low as $0.43 by 2000 and ultimately achieving the extreme downside target of $0.50 in the process.
1999 to 2003

In the period from 1999 to 2003, ATVI rose from $0.43 to as high as $3.96, a gain of +821%. The resulting decline saw ATVI drop –63%. In the chart above we do note a possible scenario that the SRL is run on the stock at the $3.12 peak, assuming you don’t know where the ultimate peak would be. In such an instance, a conservative downside target of $1.83 and a mid range target of $1.44 were calculated.
In the big scheme of things, the conservative downside target was achieved and the mid range target was one penny short of the mark in 2002. The point of this exercise is to see, what would have been the outcome if there was an error in the timing of the calculation of the downside targets. As we shall see, these situations are all too real with outcomes that are generally surprising. However, in the immediate decline after the $3.12 price peak, the conservative downside target of $1.83 was $0.02 cents short of the $1.85 low set in September 2001.
2002 to 2009

In the period from 2002 to 2009, ATVI increased in price by +1,084%. The decline that followed brought the stock down as much as –56% before a recovery ensued. Again, we have marked off the points where an error of early use of the SRL could have been applied. In each of the three examples, the conservative downside target was achieved. Suffice to say, in the case of the SRL and price peaks, the conservative downside target is a reasonable point of reference for consideration of ATVI.
2012 to 2017
The price action of ATVI has seen the stock price increase from a 2012 low of $10.08 to the 2017 high of $66.16. The gain in the stock price has been +556%. Our SRL has the following downside targets:
On December 24, 2012, Activision Blizzard (ATVI) was among the top three stocks on our Nasdaq 100 Watch List (found here). At the time, we said the following:
“Activision Blizzard (ATVI) was on the watch list on August 12, 2011 (found here) when the stock was trading at $10.71. No sooner than ATVI was on our list that it rose +30% to the November 8, 2011 high. ATVI is now selling at the same price as August 2011, however, the stock has a lower P/E ratio and a lower P/B ratio. If we suppose that the stock has not moved up at all in the last year, this could be considered an undervalued stock.”
Activision is up over +39% in only 5 months. With such excessive gains in such a short period of time, it is necessary to consider selling the stock. For investors who want to take advantage of any additional upside potential, selling only the principal is an acceptable alternative.

Comments Off on Activision Blizzard is a Sell
Posted in atvi, Sell Recommendations
Below are the Nasdaq 100 companies that are within 10% of their respective 52-week lows. Stocks that appear on our watch lists are not recommendations to buy. Instead, they are the starting point for doing your research and determining the best company to buy. Ideally, a stock that is purchased from this list is done after a considerable decline in the price and rigorous due diligence.
Below are the Nasdaq 100 companies that are within 10% of their respective 52-week lows. Stocks that appear on our watch lists are not recommendations to buy. Instead, they are the starting point for doing your research and determining the best company to buy. Ideally, a stock that is purchased from this list is done after a considerable decline in the price and rigorous due diligence.
| Symbol | Name | Price | P/E | EPS | Yield | P/B | % from low |
| VOD | Vodafone Group Public Limited Company | 25.12 | - | -0.55 | 4.1 | 1.11 | 0.68% |
| TEVA | Teva Pharmaceutical Industries Limited | 37.79 | 15.4 | 2.45 | 2.1 | 1.44 | 1.04% |
| ATVI | Activision Blizzard, Inc. | 10.68 | 13.78 | 0.78 | 1.7 | 1.09 | 2.20% |
| BBBY | Bed Bath & Beyond Inc. | 55.66 | 12.71 | 4.38 | - | 3.13 | 2.45% |
| MSFT | Microsoft Corporation | 27.06 | 14.63 | 1.85 | 3.4 | 3.36 | 5.05% |
| SPLS | Staples, Inc. | 11.28 | - | -0.01 | 3.8 | 1.26 | 6.72% |
| INTC | Intel Corporation | 20.64 | 9 | 2.29 | 4.3 | 2.1 | 7.33% |
| DLTR | Dollar Tree, Inc. | 40.05 | 16.09 | 2.49 | - | 5.91 | 7.89% |
| PAYX | Paychex, Inc. | 31.5 | 20.45 | 1.54 | 4.2 | 6.73 | 8.17% |
| NVDA | NVIDIA Corporation | 12.25 | 15.29 | 0.8 | 2.4 | 1.63 | 9.87% |
| ^NDX | NASDAQ-100 | 2,658.05 | - | - | - | - | 17.50% |
Watch List Summary
The last time that Vodafone (VOD) was this close to the low and on our watch list was September 9, 2011 (found here). At the time, our data indicated that Vodafone had a dividend yield of 7.30% and a price to book ratio of 1.01. In two months VOD rose +12% and after two years, the highest VOD was able to rise was $30 or nearly 17% from the Sept 2011 low. For us, this is an indication to be mindful of the fact that high dividend yields are not necessarily the clearest path to exception gains, unless in some cases the investor has the willingness to accept the 10% achieved within 2 months.

Teva Pharmaceutical (TEVA) was on the watch list on September 23, 2011 (found here) when the stock was trading at $35.26. At its highest point in January 2012, TEVA increased +30% from the September 2011 low. However, since the January 2012 high, TEVA has fallen –18% to the current price of $37.79 or +7.18% above the price of September 23, 2011. On September 23, 2011, TEVA sported a dividend yield of 2.10% and a P/E ratio of 10.08. Now, TEVA has a P/E of 15.4 and a dividend yield of 2.10%.

Activision Blizzard (ATVI) was on the watch list on August 12, 2011 (found here) when the stock was trading at $10.71. No sooner than ATVI was on our list that it rose +30% to the November 8, 2011 high. ATVI is now selling at the same price as August 2011, however, the stock has a lower P/E ratio and a lower P/B ratio. If we suppose that the stock has not moved up at all in the last year, this could be considered an undervalued stock.

As is often the case with most stocks, early gains are offset with declines, at least in the first year, which explains why we’re so focused on the 52-week low. Most stocks seem to run in cycles of 1 to 2 years. Stocks that fall to a new low after one year should be at or below the price from the prior year. Stocks that fall to a new low after 2 years could be significantly above the low of two years prior but a 52-week low.
Watch List Performance Review
In our ongoing review of the Nasdaq 100 Watch List, we have taken the stocks from our list of December 16, 2011 (found here) and have checked their performance one year later. The companies on that list are provided below with the closing prices from December 16, 2011 to December 14, 2012.
|
Symbol
|
Name |
2011 | 2012 | % change |
| BMC | BMC Software, Inc. | 33.17 | 40.18 | 21.13% |
| VMED | Virgin Media Inc. | 20.95 | 36.07 | 72.17% |
| CTRP | Ctrip.com International, Ltd. | 23.1 | 21.15 | -8.44% |
| SYMC | Symantec Corporation | 15.46 | 18.68 | 20.83% |
| BRCM | Broadcom Corporation | 28.72 | 32.06 | 11.63% |
| Average | 23.46% | |||
| NDX | Nasdaq 100 | 2,238.18 | 2,658.05 | 18.76% |

The performance of the top five stocks from the December 16, 2011 watch list was reasonable. However, despite the outcome after a year, all five of the stocks achieved +20% gains within the first three months.
| Symbol | Name | Price | P/E | EPS | Yield | P/B | % from Low |
| CSCO | Cisco Systems, Inc. | $18.85 | 14.26 | $1.32 | 0 | 2.26 | 1.56% |
| AMGN | Amgen Inc. | $52.24 | 10.91 | $4.79 | 0 | 2.04 | 3.94% |
| CEPH | Cephalon, Inc. | $58.63 | 11.13 | $5.27 | 0 | 1.68 | 6.60% |
| TEVA | Teva Pharma. | $51.89 | 14.16 | $3.66 | 1.70% | 2.13 | 10.43% |
| ATVI | Activision Blizzard, Inc | $11.07 | 33.55 | $0.33 | 1.50% | 1.3 | 10.81% |
| CELG | Celgene Corp. | $53.47 | 28.44 | $1.88 | 0 | 4.79 | 11.35% |
| EXPE | Expedia, Inc. | $20.96 | 14.36 | $1.46 | 1.30% | 2.15 | 14.54% |
| MSFT | Microsoft Corp. | $27.06 | 11.55 | $2.34 | 2.40% | 4.72 | 19.05% |
| MICC | Millicom Intl. Cellular | $90.27 | 5.92 | $15.24 | 2.60% | 3.06 | 19.86% |
Watch List Performance Review
| Symbol | Name | 2010 | 2011 | Change |
| APOL | Apollo Group | $56.92 | $45.82 | -19.50% |
| ERTS | Electronic Arts | $16.75 | $19.28 | 15.10% |
| FSLR | First Solar | $116.00 | $168.22 | 45.02% |
| ATVI | Activision | $10.79 | $11.07 | 2.59% |
| PPDI | Pharma Prod. | $21.20 | $27.97 | 31.93% |
| SRCL | Stericycle | $54.30 | $87.38 | 60.92% |
| GENZ | Genzyme | $55.97 | $75.38 | 34.68% |
| GILD | Gilead | $48.84 | $39.30 | -19.53% |
| Average | 18.90% | |||
| NDX | Nasdaq 100 | 1823.32 | 2392.47 | 31.22% |
Watch List Summary
Performance Review
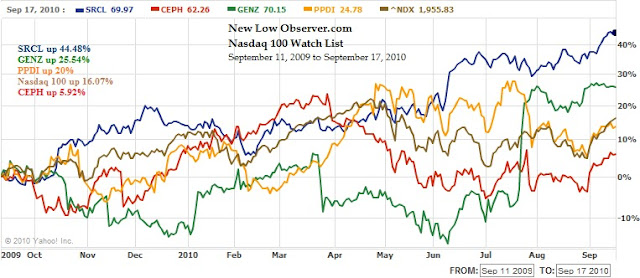 |
| *chart does not reflect dividend reinvestment for PPDI |
Nasdaq 100 Watch List
| Symbol | Name | Price | P/E | EPS | Yield | P/B | % from Low |
| PAYX | Paychex, Inc. | 25.95 | 19.67 | 1.32 | 4.80% | 6.67 | 5.27% |
| INTC | Intel Corporation | 18.81 | 11.26 | 1.67 | 3.40% | 2.3 | 6.87% |
| AMAT | Applied Materials, Inc. | 11.02 | 24.44 | 0.45 | 2.50% | 2.03 | 7.33% |
| YHOO | Yahoo! Inc. | 13.89 | 22.77 | 0.61 | N/A | 1.59 | 7.34% |
| MXIM | Maxim Integrated Products, Inc. | 16.91 | 41.86 | 0.4 | 5.00% | 2.15 | 7.91% |
| GILD | Gilead Sciences, Inc. | 34.56 | 10.47 | 3.3 | N/A | 4.58 | 8.93% |
| ATVI | Activision Blizzard, Inc | 10.82 | 41.94 | 0.26 | 1.30% | 1.21 | 8.96% |
| DELL | Dell Inc. | 12.45 | 15.74 | 0.79 | N/A | 3.92 | 9.80% |
| RIMM | Research In Motion Limited | 46.72 | 10.24 | 4.56 | N/A | 3.2 | 9.85% |
| AMGN | Amgen Inc. | 55.22 | 11.73 | 4.71 | N/A | 2.28 | 9.87% |
| DISH | DISH Network Corporation | 18.77 | 11.26 | 1.67 | N/A | N/A | 10.02% |
| CSCO | Cisco Systems, Inc. | 21.86 | 16.46 | 1.33 | N/A | 2.82 | 10.31% |
| XRAY | DENTSPLY International Inc. | 30.66 | 16.55 | 1.85 | 0.70% | 2.6 | 10.45% |
| MSFT | Microsoft Corporation | 25.22 | 12 | 2.1 | 2.10% | 4.76 | 10.95% |
| SPLS | Staples, Inc. | 19.49 | 17.26 | 1.13 | 1.80% | 2.2 | 11.69% |
| PDCO | Patterson Companies Inc. | 27.15 | 14.67 | 1.85 | 1.50% | 2.3 | 12.52% |
| SHLD | Sears Holdings Corporation | 66.83 | 27.38 | 2.44 | N/A | 0.9 | 12.87% |
| GOOG | Google Inc. | 490.15 | 21.29 | 23.03 | N/A | 3.77 | 13.03% |
| LIFE | Life Technologies Corporation | 46.51 | 29.91 | 1.56 | N/A | 1.97 | 13.16% |
| STX | Seagate Technology. | 11.16 | 3.55 | 3.14 | N/A | 1.95 | 13.41% |
| FLIR | FLIR Systems, Inc. | 27.24 | 18.52 | 1.47 | N/A | 3.25 | 13.50% |
| GRMN | Garmin Ltd. | 29.64 | 8.95 | 3.31 | 5.10% | 2.21 | 13.52% |
| TEVA | Teva Pharmaceutical Industries | 53.48 | 19 | 2.82 | 1.20% | 2.48 | 13.81% |
| FLEX | Flextronics International Ltd. | 5.55 | 15.72 | 0.35 | N/A | 2.26 | 14.20% |
| COST | Costco Wholesale Corporation | 61.29 | 21.93 | 2.8 | 1.30% | 2.43 | 14.75% |
| HSIC | Henry Schein, Inc. | 56.35 | 15.82 | 3.56 | N/A | 2.31 | 14.77% |
| CERN | Cerner Corporation | 79.18 | 31.31 | 2.53 | N/A | 3.83 | 14.85% |
| CELG | Celgene Corporation | 55.25 | 29.99 | 1.84 | N/A | 5.11 | 15.06% |
| CA | CA Inc. | 20.44 | 13.43 | 1.52 | 0.80% | 2.02 | 15.48% |
| ERTS | Electronic Arts Inc. | 16.26 | N/A | -1.06 | N/A | 1.96 | 15.63% |
| VRTX | Vertex Pharmaceuticals Incorpor | 36.25 | N/A | -3.53 | N/A | 9.01 | 16.00% |
| KLAC | KLA-Tencor Corporation | 31.05 | 25.31 | 1.23 | 3.30% | 2.32 | 16.34% |
| STLD | Steel Dynamics, Inc. | 15.01 | 15.73 | 0.95 | 2.00% | 1.58 | 16.45% |
| WCRX | Warner Chilcott plc | 22.75 | 11.2 | 2.03 | N/A | 2.82 | 16.55% |
| LOGI | Logitech International S.A. | 15.39 | 22.57 | 0.68 | N/A | 2.68 | 16.86% |
| CEPH | Cephalon, Inc. | 62.26 | 12.48 | 4.99 | N/A | 2.09 | 17.36% |
| URBN | Urban Outfitters, Inc. | 34.11 | 22.19 | 1.54 | N/A | 4.26 | 18.85% |
| FWLT | Foster Wheeler AG. | 24.19 | 10.8 | 2.24 | N/A | 3.46 | 18.99% |
| FISV | Fiserv, Inc. | 53.56 | 17.16 | 3.12 | N/A | 2.57 | 19.55% |
| JBHT | J.B. Hunt Transport Services, I | 35.26 | 26.73 | 1.32 | 1.40% | 7.56 | 19.73% |
| CTAS | Cintas Corporation | 27.71 | 19.64 | 1.41 | 1.70% | 1.67 | 19.96% |
Below are the Nasdaq 100 companies that are within 20% of their respective 52-week low. Stocks that appear on our watch lists are not recommendations to buy. Instead, they are the starting point for doing your research and determining the best company to buy. Ideally, a stock that is purchased from this list is done after a considerable decline in the price and considerable due diligence.
| Name | Price | P/E | EPS | Yield | P/B | Pct from Yr Low | |
| Gilead Sciences, Inc. (GILD) | $38.37 | 12.31 | 3.12 | 0.00% | 4.71 | 0.95% | |
| Apollo Group, Inc. (APOL) | $54.41 | 13.61 | 4.00 | 0.00% | 6.23 | 3.07% | |
| QUALCOMM (QCOM) | $36.50 | 19.47 | 1.88 | 2.10% | 2.90 | 3.60% | |
| Ryanair Holdings plc (RYAAY) | $24.60 | 0.00 | 0.00 | 0.00% | 0.00 | 3.89% | |
| Activision (ATVI) | $10.56 | 124.24 | 0.09 | 1.40% | 1.22 | 6.34% | |
| Yahoo! Inc. (YHOO) | $15.29 | 27.40 | 0.56 | 0.00% | 1.81 | 9.45% | |
| Genzyme (GENZ) | $51.77 | 125.66 | 0.41 | 0.00% | 1.84 | 9.94% | |
| Symantec (SYMC) | $15.62 | 40.57 | 0.39 | 0.00% | 3.02 | 11.82% | |
| Electronic Arts (ERTS) | $17.63 | 0.00 | 0.00 | 0.00% | 2.29 | 12.29% | |
| Cephalon, Inc. (CEPH) | $59.38 | 11.84 | 5.01 | 0.00% | 1.90 | 13.00% | |
| Logitech (LOGI) | $14.63 | 40.41 | 0.36 | 0.00% | 2.65 | 14.03% | |
| Staples (SPLS) | $21.66 | 21.17 | 1.02 | 1.60% | 2.35 | 15.71% | |
| Amgen Inc. (AMGN) | $54.46 | 11.56 | 4.71 | 0.00% | 2.37 | 17.22% | |
| RIMM (RIMM) | $64.92 | 0.00 | 0.00 | 0.00% | 0.00 | 19.56% | |
| Cintas (CTAS) | $25.54 | 23.87 | 1.07 | 1.80% | 1.61 | 19.91% |
Watch List Summary
| Company | Change from Last Week |
| Gilead Sciences, Inc. (GILD) | -3.49% |
| Apollo Group, Inc. (APOL) | -5.51% |
| QUALCOMM (QCOM) | -5.97% |
| Ryanair Holdings plc (RYAAY) | -14.47% |
| Activision (ATVI) | -4.92% |
| Yahoo! Inc. (YHOO) | -8.11% |
| Genzyme (GENZ) | -2.80% |
| Symantec (SYMC) | -7.36% |
In all, the Nasdaq 100 Watch List of last week lost -6.58% as compared to the Nasdaq 100 index which lost a total of -7.56%. As with our Dividend Achiever Watch List, the smaller losses and larger gains make the Watch Lists a good place to start investigating your next investment opportunities. Naturally, we expect that all investment decisions should be done with an eye for selectivity and a willingness to harbor a lot of patience.
| Symbol | Name | Price | P/E | EPS | Yield | P/B | % from low |
| GILD | Gilead | 39.71 | 12.74 | 3.12 | 0 | 4.86 | 0.40% |
| APOL | Apollo | 57.41 | 14.36 | 4 | 0 | 6.53 | 8.75% |
| QCOM | QUALCOMM | 38.68 | 20.63 | 1.88 | 2.00% | 3.09 | 9.08% |
| ATVI | Activision | 11.08 | 130.35 | 0.09 | 1.40% | 1.31 | 11.58% |
| GENZ | Genzyme | 53.22 | 129.17 | 0.41 | 0 | 1.91 | 13.02% |
| RYAAY | Ryanair | 28.16 | 0 | 0 | 0 | 0 | 13.46% |
| YHOO | Yahoo! Inc. | 16.53 | 29.62 | 0.56 | 0 | 1.93 | 18.84% |
| SYMC | Symantec | 16.77 | 43.56 | 0.39 | 0 | 3.13 | 20.04% |
Below are the Nasdaq 100 companies that are within 21% of the 52-week low.
| Symbol | Name | Price | P/E | EPS | Yield | P/B | % from Low |
| GILD | Gilead Sciences | 41.67 | 14.77 | 2.82 | 0 | 5.74 | 4.44% |
| QCOM | QUALCOMM | 38.25 | 30.7 | 1.25 | 1.90% | 3.08 | 7.87% |
| GENZ | Genzyme Corporation | 53.93 | 35 | 1.54 | 0 | 1.85 | 14.53% |
| ATVI | Activision Blizzard | 11.6 | 136.47 | 0.09 | 1.30% | 1.35 | 16.82% |
| RYAAY | Ryanair Holdings | 29.19 | N/A | - | 0 | 0 | 17.61% |
| APOL | Apollo Group, Inc. | 63.53 | 15.89 | 4 | 0 | 7.34 | 20.34% |
| Symbol | Name | Price | P/E | EPS | Yield | P/B | % from Low |
| GILD | Gilead | 45.7 | 16.19 | 2.82 | 0 | 6.4 | 10.63% |
| GENZ | Genzyme | 53.64 | 34.81 | 1.54 | 0 | 1.82 | 13.91% |
| RYAAY | Ryanair | 29.23 | 0 | 0 | 0 | 0 | 17.77% |
| ATVI | Activision | 11.79 | 138.71 | 0.09 | 1.30% | 1.36 | 19.33% |
| SYMC | Symantec | 16.68 | 43.32 | 0.39 | 0 | 3.1 | 19.40% |
This list is strictly for the purpose of researching whether or not the companies have viable business models or are about to go out of business. These companies are deemed highly speculative unless otherwise noted.
Below are the Nasdaq 100 companies that are within 20% of the 52-week low.
| Symbol | Name | Price | P/E | EPS | Yield | P/B | % from Low |
| QCOM | QUALCOMM | 40.05 | 32.14 | 1.25 | 1.70% | 3.17 |
12.94%
|
| FSLR | First Solar, Inc. | 113.3 | 15.05 | 7.53 | N/A | 3.65 |
14.78%
|
| GILD | Gilead Sciences, Inc. | 47.87 | 16.96 | 2.82 | N/A | 6.7 |
15.88%
|
| ERTS | Electronic Arts Inc. | 18.42 | N/A | -2.31 | N/A | 2.33 |
17.32%
|
| ATVI | Activision Blizzard, Inc | 11.82 | 139.06 | 0.09 | 1.30% | 1.39 |
20.00%
|
Nasdaq 100 Watch List Summary
Before pursuing any of these companies, be sure to verify the dividend history as well as the earnings capacity to pay the dividend (more commonly known as payout ratio).
| Symbol | Company | Price | P/E | EPS | Yield | P/B | % from low |
| MCHP | Microchip Technology | 28.25 | 31.6 | 0.89 | 4.80% | 3.53 | 43.69% |
| MXIM | Maxim Integrated Prod. | 19.14 | 71.69 | 0.27 | 4.20% | 2.31 | 48.49% |
| PAYX | Paychex, Inc. | 32.17 | 23.52 | 1.37 | 3.90% | 8.43 | 39.87% |
| LLTC | Linear Technology | 28.36 | 24.22 | 1.17 | 3.20% | N/A | 39.98% |
| ADP | ADP | 44.6 | 16.57 | 2.69 | 3.00% | 3.91 | 34.10% |
| INTC | Intel Corporation | 21.99 | 28.41 | 0.77 | 2.90% | 2.94 | 53.26% |
| PPDI | Pharma Prod. Dev. | 22.71 | 16.94 | 1.34 | 2.60% | 1.98 | 26.38% |
| XLNX | Xilinx, Inc. | 26.6 | 24.43 | 1.09 | 2.40% | 3.68 | 46.48% |
| AMAT | Applied Materials, Inc. | 12.49 | N/A | -0.07 | 2.20% | 2.37 | 23.91% |
| CMCSA | Comcast Corp. | 17.53 | 13.9 | 1.26 | 2.20% | 1.17 | 40.35% |
| KLAC | KLA-Tencor Corp. | 28.79 | N/A | -0.39 | 2.10% | 2.25 | 49.25% |
Below are the Nasdaq 100 companies that are within 21% of the 52-week low. This list is strictly for the purpose of researching whether or not the companies have viable business models or are about to go out of business. These companies are deemed highly speculative unless otherwise noted (view all.)
-Touc
| Symbol | Name | Trade | P/E | EPS | Yield | P/B | % from Low |
|---|---|---|---|---|---|---|---|
|
Apollo Group
|
56.92
|
13.70
|
4.16
|
N/A
|
6.56
|
7.82%
|
|
|
Electronic Arts
|
16.75
|
N/A
|
-2.31
|
N/A
|
2.09
|
13.56%
|
|
|
First Solar
|
116.00
|
15.46
|
7.50
|
N/A
|
4.37
|
14.97%
|
|
|
Activision
|
10.79
|
125.47
|
0.09
|
1.39%
|
1.28
|
16.65%
|
|
|
Pharma Prod.
|
21.20
|
15.81
|
1.34
|
2.83%
|
1.87
|
17.97%
|
|
|
Stericycle
|
54.30
|
26.81
|
2.03
|
N/A
|
5.36
|
18.15%
|
|
|
Genzyme
|
55.97
|
31.91
|
1.75
|
N/A
|
1.94
|
18.86%
|
|
|
Gilead
|
48.84
|
17.31
|
2.82
|
N/A
|
6.84
|
20.24%
|
| Symbol | Name | Trade | P/E | EPS (ttm) | Yield | P/B | % from Low |
|---|---|---|---|---|---|---|---|
|
Electronic Arts
|
16.06
|
N/A
|
-4.06
|
N/A
|
1.97
|
8.88%
|
|
|
Apollo Grp
|
59.22
|
14.25
|
4.16
|
N/A
|
6.23
|
12.18%
|
|
|
First Solar
|
115.10
|
15.34
|
7.50
|
N/A
|
3.94
|
14.07%
|
|
|
Stericycle
|
51.36
|
25.36
|
2.03
|
N/A
|
5.17
|
15.18%
|
|
|
Gilead Sci.
|
47.01
|
16.66
|
2.82
|
N/A
|
6.47
|
15.73%
|
|
|
Genzyme Corp.
|
55.73
|
31.77
|
1.75
|
N/A
|
1.93
|
18.35%
|
|
|
QUALCOMM
|
38.84
|
31.17
|
1.25
|
1.80%
|
2.98
|
19.00%
|
|
|
Pharma Product
|
21.65
|
13.70
|
1.58
|
2.80%
|
1.92
|
20.48%
|
|
|
Activision
|
11.11
|
45.35
|
0.25
|
1.40%
|
1.24
|
20.63%
|
-Touc
| Symbol | Name | Trade | P/E | EPS | Yield | P/B | Pct from Yr Low |
|---|---|---|---|---|---|---|---|
|
First Solar
|
114.19
|
15.22
|
7.50
|
N/A
|
3.93
|
13.17%
|
|
|
Apollo Group
|
59.93
|
14.42
|
4.16
|
N/A
|
6.45
|
13.53%
|
|
|
Gilead Sciences
|
46.38
|
16.44
|
2.82
|
N/A
|
6.43
|
14.18%
|
|
|
Activision Blizzard
|
10.21
|
41.67
|
0.25
|
N/A
|
1.14
|
15.63%
|
|
|
QUALCOMM
|
38.04
|
30.53
|
1.25
|
1.80%
|
2.99
|
16.54%
|
|
|
Electronic Arts
|
17.26
|
N/A
|
-4.06
|
N/A
|
2.08
|
17.02%
|
|
|
Genzyme
|
55.17
|
31.45
|
1.75
|
N/A
|
1.89
|
17.16%
|
|
|
Stericycle
|
52.00
|
26.58
|
1.96
|
N/A
|
5.76
|
17.22%
|