Category Archives: Art

Investment Observation: Supervalu (SVU) at $12.81

Supervalu (SVU) has been on our watch list since December 2009. After considerable analysis, I decided to pull the trigger today at $12.81, less than 5% within the 52-week low. My model showed the price of $12 to be the buy range and $15 to be the fair value. The negative earnings on the surface is a concern. However, a deeper investigation shows that the company was forced to take an impairment charge of $3,250 back in January of 2009 because of the Statement of Financial Accounting Standards (SFAS) No. 142 accounting rule. This resulted in a negative earning of $13.95 per share. The quote below was taken from the SEC filing.

For the third quarter of fiscal 2009 the Company’s stock price had a significant and sustained decline and book value per share substantially exceeded the stock price. Consistent with SFAS No. 142, the Company performed an interim impairment test of goodwill and indefinite-lived intangible assets at the end of the third quarter of fiscal 2009. Although this analysis has not been completed due to its complexity, based on the work performed to date the Company has recorded a preliminary estimate of impairment charges of $3,250, comprised of $3,000 of goodwill and $250 of indefinite-lived intangibles.

I recalled that SVU was trading at a 70% discount to book during the March low. After an adjustment, it has a book value of $12.79. I purchased the shares at book value.
Despite the consideration of these adjustments, not all is bright for SVU. The company's operating margin is 3.09%, very low compared to its competitors. A large amount of long-term debt ($8 billion) is a dark cloud that hangs over the company. Large capital expenditure will deplete their cash flow if the economy doesn't pick up. After 35 years of consecutive dividend increases, the company reduced their distribution by 50% and now pays out $0.35 or 2.8% annually. All of these factors contributed to SVU trading at such discounted level.

Forward P/E is at 6.64 times. The price-to-sales ratio is at a low of 0.06. Price-to-book value is at 1. Current dividend yield of 2.8% which exceeds the five year average yield of 2.5%. The current ratio of 1 means that the company can turn over their current assets at the same rate as their current liabilities. This is important for short-term viability concerns.

Fundamental aside, it was the technicals of SVU that prompted me to buy. From the chart below, you can see that for most of 2009 the stock trade within the $17 and $12 range. As business conditions improved and the company returned to profitability in the second half of the year, shares remained unchanged. The stock appears to be "bottoming" as it remains range bound. The moving averages are doing the same as well. A break below $12 would spell trouble and I would get out while a breakout above $17 will signal better times for SVU.
I bought the stock at $12.81 and will sell if it break below $12 (-7%). Profit will be taken around $15 (+17%).
The purpose of our investment observations is to point out quality Dividend Achievers and formers that are near a 52-week low. From this point begins the fundamental research to verify the quality of the stock for both short and long-term investing. These recommendations are within the context of the 3rd year of an 18-year secular bear market. A bear market that we expect could trade in a range between 16,000 and 5,000. The secular bear market will be considered over when the Dow Transports and Dow Industrials exceed their respective peaks on high volume or the dividend yield on the Dow exceeds 6% or higher. -Art

Speculative Observation: Cephalon Inc. (CEPH) at $62.42

The new year brings new challenges and opportunities. The first opportunity for this year may come from Cephalon (CEPH) which engages in the discovery, development, and commercialization of products for central nervous system, inflammatory disease, pain, and oncology therapeutic areas. It competes against GlaxoSmithKline plc (GSK), Johnson & Johnson (JNJ), and Sepracor Inc. Because the company doesn't pay a dividend, the New Low Observer team has to classify such a security as a speculation.

CEPH came onto our radar when we began compiling the new low data back in July when the stock was trading around $57. This was 8% above the 52 week low of $52.55. At the low, CEPH was trading at less than 15 times earnings. Although appearing to be risky, selected stocks at or near their low offer investors the opportunity to investigate quality companies for potential price increases. Our concept is laid out in the "Buy Low, Sell High" article.

CEPH has a market cap of $4.6 billion dollar. The relatively small size compared to its rivals doesn't discourage us. We only care about the market cap as a means for liquidity when buying and selling the stock. CEPH earned $3.62 per share over the last 12 months and thus has a price to earnings ratio (P/E) of 17 and a forward P/E of 10, an extraordinarily low multiple. Low P/E multiples imply that investors are paying less for every dollar of earnings (more on our view of P/E). CEPH has a book value of $28.71 per share. At $62, price-to-book is north of 2. A positive operating cash flow of $232.48M is a plus but a negative free cash flow is one of my concern ($-12.71M).

Fundamentals aside, the stock may have discounted all the negative news based on the chart pattern. In 2009, Cephalon dropped 19% as opposed to the Dow Industrials which rose 19%. Unlike the Dow which hit the yearly low in March, Cephalon bottomed in July and formed what appears to be a base. This pattern is prominent because it shows that the stock failed to move either up or down and traded in range between $60 and $53. Any break above $60 or below $53 will reveal its potential direction of the stock. Sure enough, the stock broke above $60 in late December and will look for that to be a support for the stock. The momentum indication also turned bullish as the 50-day moving average crossed the upward sloping 150-day moving average as indicated in the chart below.

Another indicator I like to refer to is the Coppock Curve (click here for more on the Coppock Curve). For Cephalon, the curve dates back to 1993. The table below shows my findings.

Date Price 3 Mo After % Change
May-95 9.81 24.25 147%
Feb-98 12.00 10.63 -11%
Sep-98 7.31 9.00 23%
Mar-99 8.75 17.38 99%
May-03 45.16 44.35 -2%
Sep-05 46.42 64.74 39%
Aug-08 76.62 73.48 -4%

The average percentage gain if you sell three months after the buy indication is 42%. Excluding the 1995 data, it is 24%. We are waiting for the indicator to turn for a possible buy signal.

A buy strategy would be to purchase this stock as close as possible to $60 or the 50 day moving average which is dynamic and constantly changing. Use the Coppock indicator as another gauge to buy and watch your gains or losses closely. - Art

Dividend Achiever Watch List

At the end of the week, my watch list contains 17 companies, same amount of companies from the previous week. Here are the companies on my watch list as of January 1, 2010.

Symbol Name Price P/E % Yr Low Yield EPS Div/Shr Payout Ratio
SVU SUPERVALU INC 12.71 -0.91 4.78% 2.75% -13.99 0.35 -3%
CWT CALIFORNIA WATER SVC 36.82 18.41 9.94% 3.20% 2.00 1.18 59%
XOM EXXON MOBIL CP 68.19 15.90 10.23% 2.46% 4.29 1.68 39%
BCR BARD C R INC 77.90 15.61 13.00% 0.87% 4.99 0.68 14%
WTR AQUA AMERICA INC 17.51 23.04 13.78% 3.31% 0.76 0.58 76%
UGI U G I CP 24.19 10.25 14.43% 3.31% 2.36 0.80 34%
THFF First Financial Corporation Ind 30.52 16.68 15.04% 2.95% 1.83 0.90 49%
WMT WAL MART STORES 53.45 15.49 15.57% 2.04% 3.45 1.09 32%
FDO FAMILY DOLLAR STORES 27.83 13.44 15.86% 1.94% 2.07 0.54 26%
SRCE 1st Source Corporation 16.09 14.50 16.26% 3.98% 1.11 0.64 58%
SYBT S.Y. Bancorp, Inc. 21.35 15.81 16.73% 3.19% 1.35 0.68 50%
UMBF UMB Financial Corporation 39.35 18.74 16.94% 1.88% 2.10 0.74 35%
WGL WGL HOLDINGS INC 33.54 14.03 17.31% 4.38% 2.39 1.47 62%
WEYS Weyco Group, Inc. 23.64 23.64 17.55% 2.54% 1.00 0.60 60%
HSY THE HERSHEY COMPANY 35.79 20.93 18.24% 3.32% 1.71 1.19 70%
AWR AMER ST WATER 35.41 21.86 18.99% 2.94% 1.62 1.04 64%
NTRS Northern Trust Corporation 52.40 13.83 20.96% 2.14% 3.79 1.12 30%
17 Companies

Happy New Year
Art

Dividend Achiever Watch List

At the end of the week, my watch list expanded to 20 companies compared to 16 companies from the previous week. Here are the companies on my watch list as of December 18, 2009.

Symbol Name Price P/E % Yr Low Yield EPS Div/Shr Payout Ratio
SVU SUPERVALU INC 12.48 -0.89 2.89% 5.61% -13.99 0.70 -5%
CWT CALIFORNIA WATER SVC 36.66 18.33 9.47% 3.22% 2.00 1.18 59%
XOM EXXON MOBIL CP 68.21 15.89 10.27% 2.46% 4.29 1.68 39%
WTR AQUA AMERICA INC 17.29 22.72 12.35% 3.35% 0.76 0.58 76%
UMBF UMB Financial Corporation 37.94 18.07 12.75% 1.95% 2.10 0.74 35%
BCR BARD C R INC 78.49 15.72 13.85% 0.87% 4.99 0.68 14%
WMT WAL MART STORES 52.85 15.30 14.27% 2.06% 3.45 1.09 32%
SRCE 1st Source Corporation 15.83 14.26 14.38% 4.04% 1.11 0.64 58%
WEYS Weyco Group, Inc. 23.09 23.09 14.82% 2.60% 1.00 0.60 60%
NTRS Northern Trust Corporation 50.07 13.21 15.58% 2.24% 3.79 1.12 30%
UGI U G I CP 24.50 10.36 15.89% 3.27% 2.36 0.80 34%
AWR AMER ST WATER 34.51 21.30 15.96% 3.01% 1.62 1.04 64%
HSY THE HERSHEY COMPANY 35.29 20.63 16.58% 3.37% 1.71 1.19 70%
SYBT S.Y. Bancorp, Inc. 21.55 15.96 17.82% 3.16% 1.35 0.68 50%
WGL WGL HOLDINGS INC 33.70 14.11 17.87% 4.36% 2.39 1.47 62%
NWN NORTHWEST NAT GAS 44.80 15.51 18.80% 3.71% 2.89 1.66 57%
THFF First Financial Corporation 31.52 17.22 18.81% 2.86% 1.83 0.90 49%
FDO FAMILY DOLLAR STORES 28.29 13.65 18.82% 1.91% 2.07 0.54 26%
BRO BROWN & BROWN INC 17.88 15.56 19.60% 1.73% 1.15 0.31 27%
SJW S J W CP 21.93 24.42 20.36% 3.01% 0.90 0.66 73%
20 Companies
New to this list is Family Dollar (FDO) and 1st Source (SRCE).

There are several stocks that are pulling back. Bard CR (BCR) fell 6% today after two downgrades and Wal-Mart (WMT) which has been retracing back to the 50-day moving average line. We'll have to see how these names perform going forward. - Art

Stock Checkup: Automatic Data Processing, Inc. (ADP)

I initiated a write up on Automatic Data Processing (ADP) on July 15th followed with a checkup on the July 30th. My original thesis of ADP was that the stock discounted the unemployment rate. The chart below shows the previous peak in the unemployment in the 1980's. Shortly after, shares of ADP peaked in May 1983. The stock didn't trade higher than the 1983 level until May 1985, two years follow.
As a result, I believe it may be time for investors to begin unloading shares of ADP. At the current price of $41.90, it is trading 34% above the yearly low and 3.6% away from the yearly high. I see this as a 34% downside risk and 3.6% reward profile, which is not much of a compelling argument to buy.
If you were to hold shares of ADP, you'd be sitting on a yield of 3.8% (assuming the original purchase price of $35). Surely that return is much greater than the average CD account and fractionally higher than treasuries. However, your principal has returned a whopping 23% is sold at or near the current price. While the company can and has raised the dividend at a double digit rate (15% CAGR since 1993), I assume that the company may not be able to retain such a pace unless growth return to the employment market.
I'm not suggesting that investor be short sighted and take any gain that comes their way, but I suggest investors to look at the valuation and the technical aspect of the stock. Currently, ADP is trading near its 2007 peak ($46.25). How likely is it that they can better their all-time high? And if they break that level, how much further can it go? See chart below.
As mentioned before, I see ADP as a bargain below $41. At $42.90, it would be wise to take some, if not all, of the profits and search for a better opportunity in the New Low Observer Watch List.

P.S. Exxon (XOM) and SUPERVALU (SVU) are currently dislike by Wall Street for various reasons. They may prove to be a better opportunity. - Art

Dow Theory

The market continues to move higher. We got a cyclical bull market confirmation within the context of a secular bear market at the close. The Industrials closed at 10,501.05, above the previous high of 10,471.58. The Transports also closed higher at 4,165.11. Art.

Stocks in Focus

Exxon (XOM) announced that it will acquire XTO Energy (XTO) in a $31 billion dollar stock deal. Shares of XOM fell 4.3% today. XOM is trading 12% above the 52 weeks low and 16% below the 52 week high. Such dislocation may provide a good opportunity to buy Exxon.
Another name that popped up today was Citigroup (C). After announcing that they will pay back $20 billion of TARP by issuing more shares, the stock fell 6.3% and is now trading below $4. I've written about the technical buy level for Citi and B of A in September. Citigroup may be a good trade if and only if it trades down to $2.60. Please note, this is purely speculation. Art.

Dividend Achiever Watch List

At the end of the week, my watch list contains 16 companies compared to 17 from the previous week. Here are the companies on my watch list as of December 4, 2009.
Symbol Name Price P/E % Yr Low Yield EPS Div/Shr Payout Ratio
WTR AQUA AMERICA INC 16.81 22.12 9.23% 3.45% 0.76 0.58 76%
WGL WGL HOLDINGS INC 31.86 13.33 11.44% 4.61% 2.39 1.47 62%
UGI U G I CP 23.59 10.00 11.59% 3.39% 2.36 0.80 34%
NTRS Northern Trust Corporation 48.69 12.85 12.42% 2.30% 3.79 1.12 30%
CWT CALIFORNIA WATER SVC 37.67 18.84 12.48% 3.13% 2.00 1.18 59%
THFF First Financial Corporation 30.03 16.41 13.19% 3.00% 1.83 0.90 49%
NWN NORTHWEST NAT GAS 43.75 15.14 16.02% 3.79% 2.89 1.66 57%
WMT WAL MART STORES 54.24 15.70 17.28% 2.01% 3.45 1.09 32%
PNY PIEDMONT NAT GAS CO 24.46 15.78 18.28% 4.42% 1.55 1.08 70%
WEYS Weyco Group, Inc. 23.84 23.84 18.55% 2.52% 1.00 0.60 60%
HSY THE HERSHEY COMPANY 35.99 21.05 18.90% 3.31% 1.71 1.19 70%
SYBT S.Y. Bancorp, Inc. 21.83 16.17 19.35% 3.11% 1.35 0.68 50%
UMBF UMB Financial Corporation 40.31 19.20 19.79% 1.74% 2.10 0.70 33%
BRO BROWN & BROWN INC 17.92 15.58 19.87% 1.73% 1.15 0.31 27%
XOM EXXON MOBIL CP 74.25 17.31 20.03% 2.26% 4.29 1.68 39%
BCR BARD C R INC 83.04 16.64 20.45% 0.82% 4.99 0.68 14%
16 Companies


It wasn't that long ago that biotech / pharma sector wasn't doing anything. The street hated them and I placed them on my watch list. On October 2, 2009, I highlighted 5 names in that sector, especially CAH. Let's take a look at where they are now.
Symbol Name 2-Oct 4-Dec %Gain
BCR BARD C R INC 77.39 83.04 7.30%
ABT ABBOTT LABORATORIES 49.84 53.78 7.91%
LLY LILLY ELI CO 32.51 37.39 15.01%
BDX BECTON DICKINSON CO 67.30 78.05 15.97%
CAH CARDINAL HEALTH INC 26.25 32.14 22.44%


Dow Jones Industrial Avg
9488 10389 9.50%

S&P 500 1025 1106 7.88%
It sure is too late now but if you see sectors that are under perform it may be a good starting point. There are a lot of utilities companies on the list but they rely heavily on interest rate so I urge you to do extensive research on them prior to purchase.

Speculation Observations: Mattson Technology (MTSN) at $2.65

Mattson Technology (MTSN) is a supplier of equipment to Semiconductor producers (i.e. Intel). Some of their competitors are Applied Materials (AMAT), Lam Research (LRCX), and Novellus (NVLS). These are 2 billion dollar plus companies versus a 130 million dollar company. Market cap doesn't tell me anything about valuation of the company, so I would ignore that figure for now.
Macro View
When the economy recovers, people feel better and they go out and buy a computer from suppliers like Dell or HP. These computer suppliers then have to ramp up their production and order more computer chips from Intel or Samsung. A demand surge triggered Intel to boost production by expanding their production capacity by purchasing more tools from the likes of Applied Materials or Mattson. This is what generally happens when the economy recovery takes place.
Market Exposure
In 2008, 19% of MTSN revenue came from Canon and 10% came from Samsung (from 2008 Annual Report). Because 90% of MTSN's revenue comes from overseas, this company is truly international company. The largest market they served is memory, which is estimated to be around 70% of their revenue. As you may guessed from going to Fry's or Best Buy, USB memory sticks sell for next to nothing. It's appropriate that this market has seen a fair share of margin contraction (lower profit). This may be the reason why the share price of Mattson and its competitors who are exposed to memory got cut in half.
Valuation
Mattson is currently trading around the $2.50 to $3.00 range. They hold $1.56 cash per share and $2.24 book value. As a result, you have a tech company with NO DEBT, trading at roughly 1.2x book value. That fits Benjamin Graham's formula. Tangible book value (this exclude IP value) is at $3.16 at the end of 2008. Because the company has negative earnings and no dividends, we can only assess valuation based on book value. Using Morningstar valuation tool, you see that over the prior of 10 years, the average trough book value is 1.2.
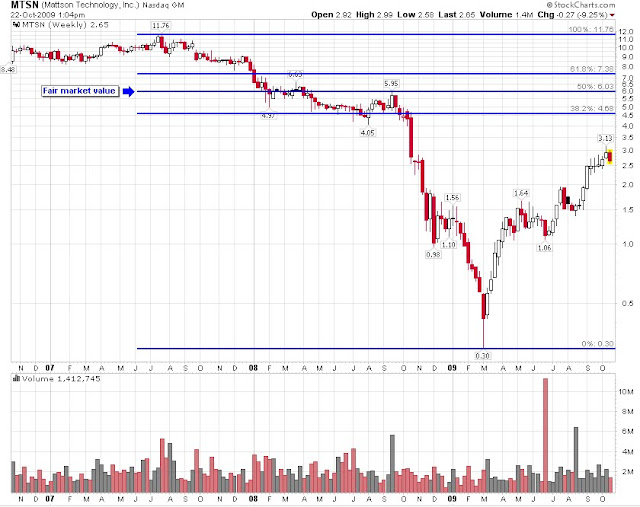
Some of the things I am concern about are negative earnings for this year and the next, possible burn in cash flow, and market liquidity issues. The company traded as high as $11.76 in 2007 then dropped to $0.30 in 2008. Assuming that you bought at the low and sold at $2.50, you would have gained 700%+ on your money. Such extreme low valuation will not likely return because the credit market have recovered somewhat.
So how do I come up with a fair market value for Mattson? Simple calculation based on Dow Theory suggest a fair market price of $6.03. The calculation is simple, take the peak price of $11.76, plus the absolute low of $0.30, then divide it by 2. That's the fair market value based on the Dow Theory interpretation. The chart below shows a graphical representation of from the peak to the most recent trough.
What You Need to Buy?
If you plan on buying MTSN as a speculation, here are things you need.
  • Strong and Healthy Heart for the up and down market. Don't be surprised if the price falls to $1.50 range.
  • Money you can "throw away". This is a speculation at best, so make sure you can lose it and still be ok.
  • Time. This company will need time to work through the current economic environment. It is safest to assume that the price will not revert to $6 simply because I wrote about it. The market will decide that.
Once again, this observation is on the deep end of the speculation pool. I've selected a stock that I believe has a lot more room on the upside but downside should be apparent based on the $0.30 low. Please do your homework and manage this speculation wisely.
Art

Disclosure: None

Follow-up Article: