Category Archives: AIG

TBTF: Too Boeing To Fail

Advocates for the bailout of Boeing (BA) are citing the “black swan” event of COVID-19 as the reason the company has reached the tipping point of failure.  These same people are saying that, in spite of Boeing:

  1. distributing defective merchandise
  2. that resulted in loss of life
  3. then lied about knowingly distributing a defective product

The company is too big to fail because the cascade of job losses throughout the entire U.S. economy would be catastrophic.

image

We’d argue that demise of Boeing began near the February 20, 2018 period.  We don’t know why it occurred at that time, However, the stock had run out of upside momentum and vacillated between the $356.66 price since that time.

The most recent decline is the culmination of the collective wisdom of the markets which decided after March 4, 2019 that the fate of the company had been determined.

As with the bank and auto bailouts of 2008, the belief is that there doesn’t exist the capacity of the largest and most broadly developed economy in the world to absorb the loss of such a big company.  Thanks to the bailout to come, we will continue to never know.

Insurance Watch List: February 2017

Performance Review

This is a review of the nearly 1-year performance of the Insurance Watch List from February 21, 2016.

image

On the whole, the analyst estimates for insurance stocks were on target.  Although AmTrust Financial Services (AFSI) did not come close to the estimated gain projected on February 2016, at least the price of the stock did not register a loss in the period of time covered.

Quote of the Day: Robert Rodriguez

“The problems of tomorrow are being created today as we write this letter. Furthermore, there are risks in the balance sheets that we cannot see. Companies such as Fannie Mae (FNM), Freddie Mac (FRE) and American International Group (AIG) are now showing financial strains from previous actions taken to enhance the look of their financial reports. We are also concerned that many of these companies have used financial derivatives that are totally unanalyzable by outsiders, since there is insufficient information disclosed in their financial statements for a risk assessment.”

Robert L. Rodriguez. Letter to Shareholders. April 16, 2005. Page 4.

  • Fannie Mae: Bailed Out/Bankrupt 2008
  • Freddie Mac: Bailed Out/Bankrupt 2008
  • AIG: Bailed Out 2008

2008 Transaction Overview

Below are all of my closed transactions for 2008 with the percentage realized gain or loss along with the percentage of the portfolio of each position. Closed positions are those that were done after the purchase of the stock took place. Therefore, purchases that took place in 2007 may have been close in 2008 while purchases in late 2008 may not have reflected a gain or loss until 2009. As an example, FDO was purchased in late December 2007 and sold late January 2008.
After transaction costs, the total return in the portfolio for 2008 was 14.35%. The dividend yield received on the account was 2.53%, with the dividend accounting for 17.62% of the total change in the account value. I am open to questions about the rational for selecting a particular stock at a given time during 2008. One thing that will be noticed about the differences between 2008 and 2009 is that 2009 has far fewer transactions.
Because this portfolio actually made money when the major indices lost close to 40% in 2008, I'm hoping to replicated this approach (mainly to avoid losing money in a market downturn.) I would appreciate any constructive insights or thoughts by you the reader. I'm hoping this will be an instructive moment for everyone involved. If you don't wish to post in the comment section then send me an email.I will be posting my transaction history for 2009 here shortly.

-Touc
Symbol
Close date
Total % Gain % of Portfolio
(FDO)
 
1/31/2008
 
10.65%
 
96.67%
(WSC)
 
2/11/2008
 
-3.93%
 
94.28%
(AIG)
 
2/28/2008
 
12.52%
 
82.65%
(CTAS)
 
3/13/2008
 
-3.81%
 
29.43%
(CDE)
 
3/13/2008
 
-12.42%
 
1.91%
(BSC)
 
3/14/2008
 
7.33%
 
26.10%
(HTX)
 
3/24/2008
 
1.73%
 
29.52%
(KGC)
 
3/24/2008
 
-16.73%
 
38.15%
(CTAS)
 
4/16/2008
 
-4.34%
 
31.11%
(GSS)
 
4/16/2008
 
-13.21%
 
1.77%
(NC)
 
7/23/2008
 
27.30%
 
32.11%
(MSA)
 
8/11/2008
 
19.02%
 
36.71%
(WIN)
 
8/14/2008
 
5.55%
 
27.27%
(BGG)
 
8/27/2008
 
1.27%
 
31.38%
(ANAT)
 
9/9/2008
 
-11.64%
 
28.26%
(EXPD)
 
9/9/2008
 
-5.51%
 
33.01%
(HPQ)
 
9/9/2008
 
115.03%
 
0.07%
(NSEC)
 
9/9/2008
 
-17.36%
 
3.08%
(TDS)
 
9/9/2008
 
-3.97%
 
38.10%
(NEM)
 
9/17/2008
 
3.27%
 
32.03%
(HL)
 
9/18/2008
 
5.70%
 
39.06%
(AIG)
 
9/23/2008
 
33.94%
 
38.27%
(ANAT)
 
9/29/2008
 
2.80%
 
29.25%
(ADM)
 
9/30/2008
 
-8.43%
 
20.77%
(WAG)
 
9/30/2008
 
-1.75%
 
44.09%
(TMR)
 
10/7/2008
 
-14.66%
 
11.36%
(NXG)
 
10/7/2008
 
-12.72%
 
11.40%
(AEM)
 
10/10/2008
 
-3.03%
 
15.58%
(FNM)
 
10/10/2008
 
-46.25%
 
7.14%
(GSS)
 
10/10/2008
 
-8.66%
 
12.11%
(JOF)
 
10/14/2008
 
2.34%
 
22.18%
(DOG)
 
10/15/2008
 
1.14%
 
43.23%
(AIG)
 
10/20/2008
 
-2.55%
 
66.35%
(BMI)
 
10/22/2008
 
-5.40%
 
35.38%
(EUM)
 
10/27/2008
 
5.26%
 
46.63%
(AEM)
 
10/28/2008
 
-4.08%
 
25.83%
(ABX)
 
10/28/2008
 
-2.92%
 
24.26%
(CTL)
 
10/31/2008
 
-9.93%
 
34.18%
(NC)
 
10/31/2008
 
-0.14%
 
43.42%
(NC)
 
11/7/2008
 
-12.16%
 
49.47%

AIG Trading Notes

Today, AIG traded up a whopping 20.46% on volume of 101,064,355 shares. On the surface of it this seems like a resounding vote of confidence for a company that is 80% owned by U.S. taxpayers. However, beneath the surface lies a murky story waiting to be told.

The story waiting to come out is that on Thurday August 6, 2009, AIG had a closing price of $22.53. During "Pre-market" trading Friday August 7th, AIG went from $22.53 to $27.37, a gain of 21.48%. The volume of shares traded during the "Pre-market" was 5,785,607 (after hour thumbnail.)

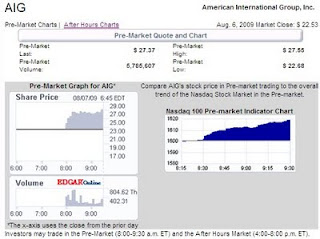
Once the regular hours of trading began on Friday August 7, 2009 the price of AIG actually fell from the $27.37 pre-market level to finally close at $27.14. Again, the regular hours of trading volume was 101,064,355.

What does all this mean? Over 5 million shares moved the price from $22.53 to $27.37. Once the regular market opened the public battled it out to come to the conclusion that the $27.37 wasn't the right price. Over 100 million only impacted the price by $0.23 lower than what 5 million was able to do by increasing the price over 20%.

My conclusion is that the public has less confidence in the future prospects for this company, and possibly the stock market, than the pre-market participants would have us believe. I also noticed that in after-hours trading the price rose an additional $0.08 on volume of 244,363 shares. Ain't it funny, 244,363 shares can raise the stock $0.08 while 100 million results in a loss of $0.23. The pre-market and after-market traders are gaming the system.

It appears that if you want to be a "trader" then you need to be entering and exiting the market before or after regular market hours. Otherwise, I would be cautious about dealing in this stock and any other stocks that are so easily managed based on so few participants. Conversely, if you're a "long term" investor then be ready to sell on a moments notice using market orders only. If you use a stop order to sell at the price of $27 then it is likely that you could get stopped out at $24 instead of $26.99 or thereabout if the stock trades down in the pre-market on Monday (wouldn't be surprised if this happens.) Touc.

Source:

Related Articles:

Please revisit Dividend Inc. for editing and revisions to this post.

This blog is being featured on www.condron.us, I hope you find this useful