Symbol |
Name |
Price |
% Yr Low |
P/E |
EPS |
Dividend |
Yield |
Payout |
FNFG |
First Niagara Financial Group Inc. |
9.15 |
0.00% |
13.66 |
0.67 |
0.64 |
6.99% |
96% |
EMR |
Emerson Electric Co. |
41.31 |
0.00% |
12.75 |
3.24 |
1.38 |
3.34% |
43% |
GTY |
Getty Realty Corp. |
14.42 |
0.00% |
8.69 |
1.66 |
1.00 |
6.93% |
60% |
NFG |
National Fuel Gas Co. |
48.68 |
0.02% |
15.65 |
3.11 |
1.42 |
2.92% |
46% |
MMM |
3M Co |
71.79 |
0.11% |
12.19 |
5.89 |
2.20 |
3.06% |
37% |
AOS |
AO Smith Corp. |
32.03 |
0.28% |
9.56 |
3.35 |
0.64 |
2.00% |
19% |
UMBF |
UMB Financial Corp. |
32.08 |
0.38% |
13.04 |
2.46 |
0.78 |
2.43% |
32% |
WFSL |
Washington Federal, Inc. |
12.74 |
0.39% |
14.81 |
0.86 |
0.24 |
1.88% |
28% |
AVP |
Avon Products, Inc. |
19.6 |
0.51% |
11.46 |
1.71 |
0.92 |
4.69% |
54% |
ATR |
AptarGroup Inc. |
44.67 |
0.61% |
16.98 |
2.63 |
0.88 |
1.97% |
33% |
XRAY |
DENTSPLY International Inc. |
30.69 |
0.92% |
16.07 |
1.91 |
0.20 |
0.65% |
10% |
BMI |
Badger Meter, Inc. |
28.93 |
0.94% |
16.44 |
1.76 |
0.64 |
2.21% |
36% |
AVY |
Avery Dennison Corp. |
25.08 |
0.97% |
9.02 |
2.78 |
1.00 |
3.99% |
36% |
DNB |
Dun & Bradstreet Corp. |
61.26 |
1.36% |
11.92 |
5.14 |
1.44 |
2.35% |
28% |
ADM |
Archer Daniels Midland Co. |
24.81 |
1.60% |
7.93 |
3.13 |
0.64 |
2.58% |
20% |
ALB |
Albemarle Corp. |
40.4 |
1.60% |
9.35 |
4.32 |
0.66 |
1.63% |
15% |
SYY |
Sysco Corp. |
25.9 |
1.65% |
13.21 |
1.96 |
1.04 |
4.02% |
53% |
CYN |
City National Corp. |
37.76 |
1.70% |
12.50 |
3.02 |
0.80 |
2.12% |
26% |
CAT |
Caterpillar Inc. |
73.84 |
1.71% |
12.20 |
6.05 |
1.84 |
2.49% |
30% |
JCI |
Johnson Controls Inc |
26.37 |
1.78% |
11.77 |
2.24 |
0.64 |
2.43% |
29% |
UGI |
UGI Corp. |
26.27 |
1.78% |
11.52 |
2.28 |
1.04 |
3.96% |
46% |
ITW |
Illinois Tool Works, Inc. |
41.6 |
1.91% |
10.98 |
3.79 |
1.44 |
3.46% |
38% |
BXS |
BanCorp.South Inc. |
8.78 |
1.97% |
18.68 |
0.47 |
0.04 |
0.46% |
9% |
EOG |
EOG Resources, Inc. |
71.01 |
2.10% |
44.66 |
1.59 |
0.64 |
0.90% |
40% |
BEN |
Franklin Resources, Inc. |
95.64 |
2.20% |
11.41 |
8.38 |
1.00 |
1.05% |
12% |
SON |
Sonoco Products Co. |
28.23 |
2.21% |
14.19 |
1.99 |
1.16 |
4.11% |
58% |
BDX |
Becton, Dickinson and Co. |
73.32 |
2.25% |
12.32 |
5.95 |
1.64 |
2.24% |
28% |
CATO |
Cato Corp. |
22.56 |
2.36% |
10.30 |
2.19 |
0.92 |
4.08% |
42% |
HP |
Helmerich & Payne, Inc. |
40.6 |
2.39% |
11.12 |
3.65 |
0.28 |
0.69% |
8% |
UVV |
Universal Corp. |
35.86 |
2.40% |
6.87 |
5.22 |
1.92 |
5.35% |
37% |
APD |
Air Products & Chemicals, Inc. |
76.37 |
2.40% |
14.22 |
5.37 |
2.32 |
3.04% |
43% |
VNO |
Vornado Realty Trust |
74.62 |
2.43% |
16.66 |
4.48 |
2.76 |
3.70% |
62% |
DOV |
Dover Corp. |
46.6 |
2.60% |
10.20 |
4.57 |
1.26 |
2.70% |
28% |
MUR |
Murphy Oil Corporation |
44.16 |
2.62% |
8.96 |
4.93 |
1.10 |
2.49% |
22% |
WAG |
Walgreen Co. |
32.89 |
2.78% |
11.19 |
2.94 |
0.90 |
2.74% |
31% |
FULT |
Fulton Financial Corp. |
7.65 |
2.82% |
11.42 |
0.67 |
0.20 |
2.61% |
30% |
CTBI |
Community Trust BanCorp., Inc. |
23.29 |
2.87% |
9.95 |
2.34 |
1.24 |
5.32% |
53% |
NUE |
Nucor Corp. |
31.64 |
2.99% |
21.38 |
1.48 |
1.45 |
4.58% |
98% |
SBSI |
Southside Bancshares, Inc. |
18.01 |
3.00% |
8.00 |
2.25 |
0.72 |
4.00% |
32% |
AROW |
Arrow Financial Corp. |
22.25 |
3.00% |
11.84 |
1.88 |
0.97 |
4.36% |
52% |
TRMK |
Trustmark Corp. |
18.15 |
3.01% |
10.93 |
1.66 |
0.92 |
5.07% |
55% |
BOH |
Bank of Hawaii Corp. |
36.4 |
3.12% |
10.80 |
3.37 |
1.80 |
4.95% |
53% |
BMS |
Bemis Co Inc |
29.31 |
3.17% |
14.58 |
2.01 |
0.96 |
3.28% |
48% |
MSEX |
Middlesex Water Company |
17.07 |
3.20% |
18.55 |
0.92 |
0.73 |
4.28% |
79% |
EXPD |
Expeditors International of Washington |
40.55 |
3.23% |
23.17 |
1.75 |
0.50 |
1.23% |
29% |
GE |
General Electric Co |
15.22 |
3.40% |
11.98 |
1.27 |
0.60 |
3.94% |
47% |
GS |
Goldman Sachs Group, Inc. |
94.55 |
3.45% |
9.27 |
10.20 |
1.40 |
1.48% |
14% |
ARE |
Alexandria Real Estate Equities, Inc. |
61.39 |
3.47% |
21.47 |
2.86 |
1.88 |
3.06% |
66% |
PPG |
PPG Industries, Inc. |
70.66 |
3.50% |
11.15 |
6.34 |
2.28 |
3.23% |
36% |
WBS |
Webster Financial Corp. |
15.3 |
3.52% |
12.24 |
1.25 |
0.20 |
1.31% |
16% |
BRO |
Brown & Brown, Inc. |
17.8 |
3.55% |
16.18 |
1.10 |
0.32 |
1.80% |
29% |
GBCI |
Glacier BanCorp., Inc. |
9.37 |
3.65% |
16.44 |
0.57 |
0.52 |
5.55% |
91% |
SWK |
Stanley Black & Decker, Inc. |
49.1 |
3.87% |
13.68 |
3.59 |
1.64 |
3.34% |
46% |
MLM |
Martin Marietta Materials, Inc. |
63.22 |
3.98% |
34.36 |
1.84 |
1.60 |
2.53% |
87% |
SUSQ |
Susquehanna Bancshares, Inc. |
5.46 |
4.00% |
21.00 |
0.26 |
0.08 |
1.47% |
31% |
BMO |
Bank of Montreal |
55.85 |
4.09% |
11.24 |
4.97 |
2.71 |
4.85% |
55% |
CFR |
Cullen/Frost Bankers, Inc. |
45.86 |
4.13% |
12.99 |
3.53 |
1.84 |
4.01% |
52% |
LNC |
Lincoln National Corp. |
15.63 |
4.20% |
4.56 |
3.43 |
0.20 |
1.28% |
6% |
HIG |
Hartford Financial Services Group Inc. |
16.14 |
4.26% |
4.62 |
3.49 |
0.40 |
2.48% |
11% |
SJW |
SJW Corp. |
21.77 |
4.31% |
16.37 |
1.33 |
0.69 |
3.17% |
52% |
NTRS |
Northern Trust Corp. |
34.98 |
4.39% |
13.88 |
2.52 |
1.12 |
3.20% |
44% |
TROW |
T. Rowe Price Group, Inc. |
47.77 |
4.42% |
16.76 |
2.85 |
1.24 |
2.60% |
44% |
WSFS |
WSFS Financial Corp. |
31.57 |
4.43% |
15.55 |
2.03 |
0.48 |
1.52% |
24% |
PBI |
Pitney Bowes Inc |
18.8 |
4.44% |
11.33 |
1.66 |
1.48 |
7.87% |
89% |
PEP |
PepsiCo Inc. |
61.9 |
4.47% |
15.75 |
3.93 |
2.06 |
3.33% |
52% |
TRV |
The Travelers Companies, Inc. |
48.73 |
4.53% |
9.21 |
5.29 |
1.64 |
3.37% |
31% |
CBSH |
Commerce Bancshares, Inc. |
34.75 |
4.57% |
12.32 |
2.82 |
0.92 |
2.65% |
33% |
PH |
Parker Hannifin Corp. |
63.13 |
4.59% |
9.91 |
6.37 |
1.48 |
2.34% |
23% |
TDS |
Telephone and Data Systems, Inc |
21.25 |
4.68% |
11.87 |
1.79 |
0.47 |
2.21% |
26% |
FRS |
Frisch's Restaurants, Inc |
19.4 |
4.70% |
10.37 |
1.87 |
0.64 |
3.30% |
34% |
CBU |
Community Bank System, Inc. |
22.69 |
4.71% |
11.64 |
1.95 |
1.04 |
4.58% |
53% |
UTX |
United Technologies Corp. |
70.36 |
4.83% |
13.64 |
5.16 |
1.92 |
2.73% |
37% |
T |
AT&T Inc |
28.52 |
4.85% |
8.29 |
3.44 |
1.72 |
6.03% |
50% |
PAYX |
Paychex, Inc. |
26.37 |
4.98% |
17.94 |
1.47 |
1.24 |
4.70% |
84% |
Another company to highlight this week is Avon Products (AVP). This cosmetics producer is extremely undervalued according to historical cash flow and dividend yield. At almost 5% dividend yield and a healthy payout ratio, we believe Avon is a stock one to pay attention to. The stock is undervalued at or around 3.7% dividend yield so the current 4.69% yield suggests that AVP has at least 25% upside. If based on AVP's cash flow we get a more bullish picture. Valueline shows Avon trades around 14x cash flow and with 2012 consensus at $2.80 per share, Avon's fair value appears to be at $39, a figure that is twice the current price.
Finally, Allstate (ALL) was ranked 9th on the list and has managed to fall off of our current list. Prior to 2008, Allstate had increased the dividend for 14 years in a row. However, the financial crisis took its toll on the company requiring a dividend cut of 51%. Allstate recently increased the dividend in March of this year.
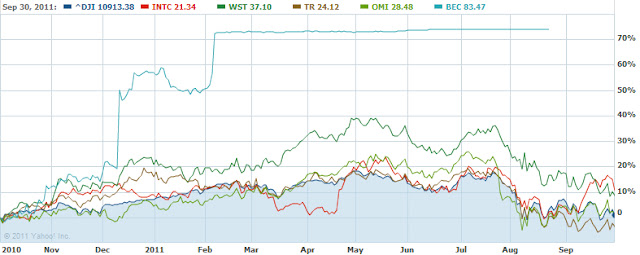
Watch List Performance Review
In our ongoing review of the NLO Dividend Watch List, we have taken the top five stocks on our list from September 10, 2010 and have checked their performance one year later. The top five companies on that list can be seen in the table below.
| Symbol | Name | 9/10/2010 | 9/9/2011 |
% change
|
| INTC | Intel Corp. | 17.97 | 19.7 | 9.63% |
| WST | West Pharmaceutical Services | 33.65 | 37.78 | 12.27% |
| TR | Tootsie Roll Industries Inc | 23.87 | 23.67 | -0.84% |
| OMI | Owens & Minor, Inc. | 26.44 | 27.72 | 4.84% |
| BEC | Beckman Coulter, Inc. | 45.71 | 83.47 | 82.61% |
|
Avg.
|
21.70% | |||
| Dow Industrials | 10,462.77 | 10,992.13 | 5.06% |