Monthly Archives: February 2011

NLO Dividend Watch List

Our watch list this week contains 22 companies that are within 10% of their 52-week low.

February 25, 2011 Watch List

Symbol Name Price % Yr Low P/E EPS (ttm) Dividend Yield Payout Ratio
RBCAA Republic BanCorp., Inc.  17.21 2.44% 5.57 3.09 0.57 3.31% 18%
SYY Sysco Corp. 27.91 2.88% 14.39 1.94 1.04 3.73% 54%
CWT California Water Service 35.13 3.90% 18.59 1.89 1.23 3.50% 65%
PPL PP&L Corporation 24.81 4.46% 11.43 2.17 1.40 5.64% 65%
MRK Merck & Co., Inc 32.19 4.85% 9.41 3.42 1.52 4.72% 44%
JNJ Johnson & Johnson   59.64 4.89% 12.48 4.78 2.16 3.62% 45%
HCBK Hudson City Bancorp, Inc. 11.38 5.37% 10.44 1.09 0.60 5.27% 55%
PEP PepsiCo Inc. 63.6 5.44% 16.22 3.92 1.92 3.02% 49%
WABC Westamerica BanCorp.  51.8 6.37% 16.14 3.21 1.44 2.78% 45%
LLY Eli Lilly & Co. 34.09 6.46% 7.44 4.58 1.96 5.75% 43%
CL Colgate-Palmolive Co. 78.12 6.84% 18.13 4.31 2.12 2.71% 49%
ABT Abbott Laboratories 47.64 6.84% 16.09 2.96 1.92 4.03% 65%
MCY Mercury General Corp. 40.62 7.18% 14.61 2.78 2.40 5.91% 86%
AWR American States Water Co. 33.68 7.81% 22.91 1.47 1.04 3.09% 71%
WMT Wal-Mart Stores, Inc. 51.75 8.33% 11.60 4.46 1.21 2.34% 27%
TGT Target Corp. 52.36 8.56% 13.71 3.82 1.00 1.91% 26%
FCBC First Community Bancshares 12.52 8.87% 10.18 1.23 0.40 3.19% 33%
CAG ConAgra Foods, Inc. 23.00 9.42% 15.44 1.49 0.92 4.00% 62%
NWN Northwest Natural Gas Co. 46.05 9.90% 16.39 2.81 1.74 3.78% 62%
KMB Kimberly-Clark Corp. 65.08 9.97% 14.62 4.45 2.80 4.30% 63%
WEYS Weyco Group, Inc.  24.58 10.27% 21.37 1.15 0.64 2.60% 56%
VLY Valley National BanCorp.  13.67 10.87% 16.88 0.81 0.72 5.27% 89%
22 Companies


Watch List Summary

On the top of our list this week is Republic Bancorp (RBCAA). It is a small regional bank with market cap of just $360 million. The company has an impressing record of dividend payments even through the financial crisis (see chart). Despite the turmoil in the market, it managed to keep the payout ratio below 40%. The highest that figure came was in 2007 at 37%. Republic Bancorp may worth looking into.

Next on our list is Sysco (SYY), a distributor to the food service industry. Our guess is that the stock has been hit by the high food costs and the inability to pass such costs on to customers. What the market may be overlooking is the short-term fundamentals versus the longer-term viability. As recent as last month Sysco raised their dividend payout by 4%.  This is an indication that company management believes that, despite the high food prices, prospects for Sysco aren't as dire as people may believe.

After topping our list two weeks ago, Abbott (ABT) rose 4.5%.

Top Five Performance Review

In our ongoing review of the NLO Dividend Watch List, we have taken the top five stocks on our list from February 26, 2010 and have check their performance one year later. The top five companies on that list can be seen in the table below.

Symbol Name 2010 Price 2011 Price % change
THFF First Financial Corp. 26.28 32.22 22.60%
XOM Exxon Mobil Corp.   65.00 85.34 31.29%
MON Monsanto Co. 70.65 72.21 2.21%
CWT California Water Service 35.88 35.13 -2.09%
SRCE 1st Source Corp.  14.93 19.4 29.94%


Average 16.79%


DJI Dow Jones Industrial 10,325.26 12,130.45 17.48%
SPX S&P 500 1,104.49 1,319.88 19.50%

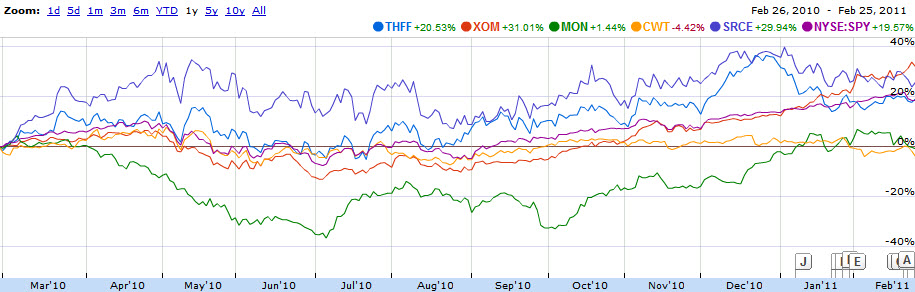
The performance of our top five stocks were not as impressive as the overall market. California Water (CWT) and Monsanto (MON) held our list to a 16% average gain. Monsanto took a big hit mid-year when the company reduced earning guidance mid year. The shares tumbled and nearly marked the -40% zone as seen in the chart. Investors who went against the tide and bought Monsanto in June/July were handsomely rewarded.

Disclaimer

On our current list, we excluded companies that have no earnings. Stocks that appear on our watch lists are not recommendations to buy. Instead, they are the starting point for doing your research and determining the best company to buy. Ideally, a stock that is purchased from this list is done after a considerable decline in the price and extensive due diligence. We suggest that readers use the March 2009 low (or the companies' most distressed level in the last 2 years) as the downside projection for investing. Our view is to embrace the worse case scenario prior to investing. A minimum of 50% decline or the November 2008 to March 2009 low, whichever is lower, would fit that description. It is important to place these companies on your own watch list so that when the opportunity arises, you can purchase them with a greater margin of safety. It is our expectation that, at the most, only 1/3 of the companies that are part of our list will outperform the market over a one-year period.

Please revisit New Low Observer for edits and revisions to this post. Email us.

Nasdaq 100 Watch List

Below are the Nasdaq 100 companies that are within 20% of the 52-week low. This list is strictly for the purpose of researching whether or not the companies have viable business models. Although theses companies are very risky, they provide significant opportunity to outperform the market in the coming year.
Symbol Name Price P/E EPS Yield P/B % from Low
CSCO Cisco Systems, Inc. $18.85 14.26 $1.32 0 2.26 1.56%
AMGN Amgen Inc. $52.24 10.91 $4.79 0 2.04 3.94%
CEPH Cephalon, Inc. $58.63 11.13 $5.27 0 1.68 6.60%
TEVA Teva Pharma. $51.89 14.16 $3.66 1.70% 2.13 10.43%
ATVI Activision Blizzard, Inc $11.07 33.55 $0.33 1.50% 1.3 10.81%
CELG Celgene Corp. $53.47 28.44 $1.88 0 4.79 11.35%
EXPE Expedia, Inc. $20.96 14.36 $1.46 1.30% 2.15 14.54%
MSFT Microsoft Corp. $27.06 11.55 $2.34 2.40% 4.72 19.05%
MICC Millicom Intl. Cellular $90.27 5.92 $15.24 2.60% 3.06 19.86%

Watch List Performance Review

In our ongoing review of the Nasdaq 100 Watch List, we have taken the stocks from our list of February 21, 2010 (article here) and have checked their performance one year later. The companies on that list are provided below with the closing price for February 19, 2010 and February 18, 2011. 
Four of the companies on our list managed to exceed the Nasdaq 100 while the other four on the list underperformed the index.  Stericycle (SRCL) was the biggest winner with a 60.92% gain.  Gilead Sciences (GILD) was the biggest loser over the last year with a decline of -19.53%.
Symbol Name 2010 2011 Change
APOL Apollo Group $56.92 $45.82 -19.50%
ERTS Electronic Arts $16.75 $19.28 15.10%
FSLR First Solar $116.00 $168.22 45.02%
ATVI Activision $10.79 $11.07 2.59%
PPDI Pharma Prod. $21.20 $27.97 31.93%
SRCL Stericycle $54.30 $87.38 60.92%
GENZ Genzyme $55.97 $75.38 34.68%
GILD Gilead $48.84 $39.30 -19.53%
Average 18.90%
NDX Nasdaq 100 1823.32 2392.47 31.22%
Please revisit New Low Observer for edits and revisions to this post. Email us.

Illumina Shines After Appearing on Watch List

In yesterday’s note, we outlined what appears to be the conclusion of Sanofi-Aventis’ (SNY) attempt to buy Genzyme (GENZ) in a $20 billion deal that was 7 months in the making. Genzyme was on our October 30, 2009 Nasdaq 100 Watch List before Sanofi-Aventis made the initial offered to buy Genzyme (GENZ) in July of 2010. At the time, the New Low team suggested that because so many of the companies on our Nasdaq 100 Watch List were in the drug sector, there was likely to be acquisitions or merger in the same industry. The alternative reaction is for individual investors to bid the price of the stocks higher.

On our December 19, 2009 Nasdaq 100 Watch List, Genzyme (GENZ) shared a place on the list with Illumina (ILMN) (article here). As mentioned yesterday, the price performance of Illumina (ILMN) since being on our December 19, 2009 Watch List has been amazing. Below is a comparison chart of Illumina (ILMN) and Genzyme (GENZ).


Illumina (ILMN) has managed to increase in value by over 3 times as much as Genzyme in the same period. Even the sweetened offer by Sanofi-Aventis, from $69 a share to $74, is not enough to put a dent in the gap between Illumina’s performance against Genzyme. In mid-January 2010 (article here), we pointed out the strength of Illumina’s reported earnings which pushed up the share of the company 15% in a single day. Purchase of ILMN in mid-January 2010 have overshadowed the rise of Genzyme in its path to acquisition.

For companies that appear on our Dividend or Nasdaq 100 lists, we believe it is only a matter of time before the market recognizes the value. In many instances, even a cursory overview of the company’s financial information using sources like Value Line, Morningstar and Mergent (assuming the worst case scenario) can provide a fair approximation of true worth.

Please revisit New Low Observer for edits and revisions to this post. Email us.

New Low Team Nails it on Genzyme Deal

It appears that the long predicted outcome for Genzyme (GENZ) is about to come to fruition.  In our October 30, 2009 Nasdaq 100 watch list (article here), we suggested that because of the concentration of drug companies at or near a new low, the prospects were good that an acquisition had to take place in the industry. 
We had already highlighted the individual prospects of Genzyme on October 17, 2009 (article here).  In that piece, we said:
"Finally we have Genzyme Corp. (GENZ) at $55.94. This stock has historically traded at 19 times cashflow. The 2008 cashflow for this GENZ was $2.82, according to Mergent’s (Valueline had the higher figure.) GENZ, although selling 19% above the 52-week low, is a far superior value proposition. The shares outstanding have grown by 2.7% from 2006 to 2008 while the long-term debt has fallen by 85% over the same time frame."
Apparently, it took Sanofi-Aventis nearly 9 months to realize the Genzyme was as good as we believed it to be.  Sanofi-Aventis offered $69 in July of 2010 but Genzyme's natural reaction was to say, "pay or don't play."  Sanofi-Aventis caved and offered $74 to close the deal. 
In a fashion similar to a ratings agency, Moody's decided to suggest that it may raise the credit rating of Genzyme.  Duh!  The company is about to ink a $20 billion takeover offer.  This raises the prospect that another company will step in and make a counter offer for Genzyme.  This could lead to a true bidding war thereby nullifying the need for credit ratings for the purposes of borrowing money. 

We hope that the work we have done on this site is evidence of the soundness of our strategy.  Tomorrow we will outline another stock from our Nasdaq 100 Watch List that has made the Genzyme deal look like peanuts in comparison.

Please revisit New Low Observer for edits and revisions to this post. Email us.

Speculation Observation: Cephalon at $58.99

Lately, in the pharmaceutical industry, it seems that you just can’t win. The big pharma companies are being thrown under the bus because of patent expirations, diminished pipelines and lawsuits. On the horizon are the firms most likely to be considered the next big pharma with a pipeline of products but also facing patent expirations and lawsuits.
In the case of Cephalon (CEPH), it couldn’t catch a break if it was handed to them. On Friday February 11, 2011, Barron’s came out with an analyst report (article here) that downgraded Cephalon from “Average” to “Below Average” with a price target of $54. Considering that Cephalon was already selling within 8.5% of the 52-week low at the time the article was published, we’re not sure if Caris & Co. meant to avoid giving a sell recommendation or not.
The problem with Cephalon, according to research firm Caris & Co., is that the late stage pipeline of products coming due may not boost revenue if sales of recently introduced Nuvigil are any indication. Combined with the fact that Provigil, which contributes 50% to Cephalon’s revenue stream, is due to face patent expiration in April of 2012 and we’ve got a recipe for disaster. Caris & Co also feels that the three pipeline drugs (Lupuzor, Cinquil and CEP-33237) hold no promise for either treatment or commercial value.  Adding to the caustic mix of diminishing sales from existing products and sub par pipeline are two court cases (Fentora and Amrix) which are likely not to go Cephalon’s way.
Not to be outdone, on February 15, 2011, a Jefferies & Co. analyst downgraded Cephalon to “Underperform” from “Buy”(article here). With the current price of CEPH going for around $58, it was shocking that the Jefferies analyst didn’t indicate that the stock should be sold considering that he (Corey Davis) has a target price of $48 instead of the previous price of $77.
If Mr. Davis feels so confident that CEPH is really worth 17% less than the current price why would it merely “underperfom” one day when only the day before it was indicated to possibly rise by 32%. With a spread of 60% in his change of opinion, it becomes challenging to believe Mr. Davis isn’t parroting the downgrade given by Caris & Co. that had such a large impact on stock price on February 11th.
Although we know how hard it is for some research and investment firms to actually say sell, the timing of these calls couldn’t be more poorly selected. Even if the stock were to accomplish the $48 level, it is too little too late. Investors needed to know that at $72 (52-week high) the stock was overpriced. Telling us that things won’t go well now is a slap in the face to some who possibly bought the stock at much higher levels. Our sell recommendation of Cephalon at $71 in early March 2010 (article here) was only rivaled by our initial speculative observation at $57 in late August 2009 (article here).
Since Cephalon is so close to the low and the negativity is running so high, we decided to run some numbers to see what the worst case scenario could be if the company were to actually survive (by the way, we think it will.)
According to Value Line dated January 14, 2011, the book value for Cephalon in 2009 was $30.19. Prior to the recession that began in 2007, Cephalon had its lowest price-to-book (P/B) ratio at 2.66 back in 2003. At that time, Cephalon had a price-to-earnings (P/E) ratio of 23.
Currently, Cephalon is selling for 11 times earnings and if the stock price were to match the P/B of 2003 then CEPH would be selling for $80. If we assume that Cephalon can only accomplish half of the $80 target, then the stock should rise to $69 or 19% above the current level.
On a cash flow basis, Value Line estimated the cash flow for 2010 to be $8.55 per share. Based on the average low price-to-cash flow (P/CF) over the last three years, the stock should be trading at $67.29. If considered on the lowest level of the high range in the P/CF over the last three years, CEPH would be selling for $72.85. The last 3 years are utterly the lowest on a relative basis making comparisons over this period the most conservative possible.
All of the scenarios indicated above assume that Cephalon doesn’t find a way to increase their earnings going forward. Since the big name analysts are in agreement that this company is dead on arrival, we feel this company is worth a balanced second opinion. If for some reason the analysts are right about this company, then the downside target or downside risk is that the stock would fall to $51.63. However, considering the speculative nature of this selection (as with all Nasdaq 100 stocks) we prefer that CEPH occupy only a small portion of the portfolio while accepting at least 50% losses.

Article Links:


Please revisit New Low Observer for edits and revisions to this post. Email us.

Dow Theory: Continuation of Bull Market Confirmed

On Friday February 11, 2011, The Dow Jones Industrial Average (DIA) and the Dow Jones Transportation Average (IYT) registered Dow Theory bull market confirmations. This confirmation is a continuation of the first bull market indication that was given on July 23, 2009.

The majority of the Dow Theory bull market confirmations since July 2009 has hinged on the movement of the Transportation Average and this most recent indication has been no exception. In accomplishing the Dow Theory confirmation of the bull market, the Transportation Average had to overcome significant technical resistance. In the chart below, you will see that the decline and recovery in the last month has been dramatic.

Over the last month, the Transportation Average has managed to succumb to an inverted head-and-shoulders pattern. This suggest that there is strength in the rise of the Industrials and Transports most recent bull market confirmation since, as the chart below demonstrates, the Industrial Average never let on that there was any weakness to the same extent that the Transports did.

In the last Dow Theory confirmation of the bull market on November 3, 2010 (article here), the Dow Industrials fell about 2% (on a closing basis) over a period of 29 days before regaining its footing and heading to the current level. From the November 3, 2010, it took 101 days for the Dow Industrials to rise 9.44% and the Dow Transports to rise 7.69%.

Looking ahead, if the markets were to replicate the prior modest moves in the same period of time then we could expect an intermediate low around March 11, 2011 with the Industrials and Transports peaking at 13,431.86 and 5638.12 on May 22, 2011, respectively. Our recent article on where the market might top (article here) indicated that June 18, 2011 is the farthest out we could project on a cycle basis. We now have refined this assessment down to between May 22nd and June 18th.

It would be exceptional if the market could accomplish the 13,000 level given the current valuation and the uninterrupted (no Dow Theory bear market indications) run we’ve had since the first Dow Theory bull market indication on July 23, 2009. Achieving 13,000 is only 6% away however, what is more important is sustaining the momentum.

Naturally, the alternative to this optimistic market forecast is that the Industrials and the Transports give a bear market signal somewhere between May 22nd and June 18th. Simultaneously falling below 9,700 for the Industrials and 3,900 on the Transports would indicated that a new bear market has begun. Until then, we can look forward to modest gains and nearly full exposure to the stock market for the next 2-4 months.

NLO Dividend Watch List

The market continued its upward momentum this week.  The Dow Industrial reached another yearly high while the Dow Transport reconfirmed the move on the upside.  Our Dow Theory article will be posted shortly.  Our watch list this week contains 16 companies that are within 10% of their 52-week low. 

February 11, 2011 Watch List

Symbol Name Price % Yr Low P/E EPS (ttm) Dividend Yield Payout Ratio
ABT Abbott Laboratories 45.56 2.18% 15.39 2.96 1.76 3.86% 59%
SYY Sysco Corp. 28.24 4.09% 14.48 1.95 1.04 3.68% 53%
PPL PP&L Corporation 24.75 4.21% 13.67 1.81 1.40 5.66% 77%
WABC Westamerica BanCorp.  51.00 4.72% 15.89 3.21 1.44 2.82% 45%
MCY Mercury General Corp. 40.07 5.73% 10.46 3.83 2.40 5.99% 63%
PEP PepsiCo Inc. 63.87 5.89% 16.09 3.97 1.92 3.01% 48%
HCBK Hudson City Bancorp 11.48 6.30% 10.53 1.09 0.60 5.23% 55%
AWR American States Water 33.22 6.34% 22.60 1.47 1.04 3.13% 71%
CWT California Water Service 36.04 6.60% 19.07 1.89 1.23 3.41% 65%
JNJ Johnson & Johnson   60.70 6.75% 12.70 4.78 2.16 3.56% 45%
CAG ConAgra Foods, Inc. 22.52 7.14% 15.11 1.49 0.92 4.09% 62%
MRK Merck & Co., Inc 33.07 7.72% 118.11 0.28 1.52 4.60% 543%
LLY Eli Lilly & Co. 34.52 7.81% 7.54 4.58 1.96 5.68% 43%
CL Colgate-Palmolive Co. 78.92 7.93% 18.31 4.31 2.12 2.69% 49%
WEYS Weyco Group, Inc.  24.36 9.98% 21.18 1.15 0.64 2.63% 56%
NWN Northwest Natural Gas 45.36 9.49% 16.14 2.81 1.74 3.84% 62%
16 Companies


Watch List Summary

Abbott (ABT) topped our list again this week. Again we speculate that the company could easily raise its dividend from $0.44 to $0.48 (9% increase) in the coming months. At current price, estimated dividend yield will be north of 4%. Sysco (SYY) took a hit after the earning came short of analyst estimate. Shares fell 3.25% since last watch list.

Top Five Performance Review

In our ongoing review of the NLO Dividend Watch List, we have taken the top five stocks on our list from February 19, 2010 and have check their performance one year later. The top five companies on that list can be seen in the table below.

Name Symbol 2010 Price 2011 Price % change
First Financial Corp. THFF 26.49 32.1 21.18%
EXXON MOBIL CP XOM 64.8 82.82 27.81%
CALIFORNIA WATER CWT 35.92 36.04 0.33%
AMER ST WATER AWR 32.05 33.22 3.65%
AQUA AMERICA INC WTR 16.59 23.43 41.23%


Average 18.84%


Dow Jones Industrial DJI 10,099.14 12,273.29 21.53%
S&P 500 SPX 1,075.51 1,329.15 23.58%


Disclaimer
On our current list, we excluded companies that have no earnings. Stocks that appear on our watch lists are not recommendations to buy. Instead, they are the starting point for doing your research and determining the best company to buy. Ideally, a stock that is purchased from this list is done after a considerable decline in the price and extensive due diligence. We suggest that readers use the March 2009 low (or the companies' most distressed level in the last 2 years) as the downside projection for investing. Our view is to embrace the worse case scenario prior to investing. A minimum of 50% decline or the November 2008 to March 2009 low, whichever is lower, would fit that description. It is important to place these companies on your own watch list so that when the opportunity arises, you can purchase them with a greater margin of safety. It is our expectation that, at the most, only 1/3 of the companies that are part of our list will outperform the market over a one-year period.

Please revisit New Low Observer for edits and revisions to this post. Email us.

Nasdaq 100 Watch List

As with our most recent Dividend watch list (found here), the Nasdaq 100 watch list is ladened with biotechnology and pharmaceutical companies. From our experience, this indicates that the sector as a whole is reasonably undervalued.  We think that now is the time to selectively acquire as many of these companies as possible.  It is times like these that mergers, acquisitions and bidding wars should soon follow.

Below are the Nasdaq 100 companies that are within 20% of the 52-week low. This list is strictly for the purpose of researching whether or not the companies have viable business models. Although theses companies are very risky, they provide significant opportunity to outperform the market in the coming year.


Symbol Name Price P/E EPS Yield P/B % From Low
CELG Celgene Corp $51.29 27.28 1.88 0 4.42 6.81%
CEPH Cephalon $59.96 11.2 5.35 0 1.81 9.02%
QGEN Qiagen N.V. $18.48 29.06 0.64 0 1.77 9.61%
AMGN Amgen $55.20 11.52 4.79 0 2.16 9.83%
TEVA Teva Pharma. $54.10 16.65 3.25 1.30% 2.26 15.13%
CSCO Cisco Systems $22.05 16.09 1.37 0 2.73 16.05%
ATVI Activision $11.74 39.93 0.29 1.30% 1.31 17.52%
URBN Urban Outfitters $34.76 21.6 1.61 0 4.21 19.74%

Watch List Summary


The following is the order that we think the watch list companies might perform over the next year (from best to worst on a percentage basis) and our thoughts on the reasons why.
  • Celgene (CELG): Celgene has no debt, strong earnings growth, while the book value has increased nearly 50% in the last 5 years.
  • Urban Outfitter (URBN): This clothing retailer has no debt and a book value increase of nearly 24% in the last ten years. We do not expect the same growth rate of the book going forward since the fashion industry is so fickle.
  • Teva Pharmaceutical (TEVA): Although saddled with some debt, this Israeli based pharmaceutical company is undervalued on a cash flow basis by 23% according to Value Line.
  • Cisco Systems (CSCO): One drawback for Cisco Systems is its management team which appears highly compensated for lackluster performance in the stock price. Despite this concern, CSCO has reduced the shares outstanding by nearly 23% since 2001. However, this may be a result of the large amount of debt that has been taken on since 2006. Such borrowing may be prudent given the current low interest rate environment. The book value for CSCO has grown almost 12% annually over the last 10 years.
  • Amgen (AMGN): Amgen has reduced the shares outstanding by nearly 23% since 2002. Unfortunately, the share reduction has been at the expense of a nearly 250% increase of long-term debt in the same period of time. According to Value Line dated December 17, 2010, AMGN normally trades around 12 times cash flow. Using the most conservative numbers provided by Value Line, AMGN should be selling at $72 a share instead of the current price of $55.20.
  • Cephalon (CEPH): There is a severe disconnect with Cephalon and the stock market. CEPH shares trade at less than the 2001 high. According to Value Line, the annualized growth rate of the book value over the same period has been 26%. The company’s debt has remained relatively steady while the number of shares outstanding has grown by “only” 7.6% annually. CEPH should be selling for at least $76 if the numbers on this company are accurate.

Watch List Performance Review
In our ongoing review of the Nasdaq 100 Watch List, we have taken the stocks from our list of February 7, 2010 (article here) and have checked their performance one year later. The companies on that list are provided below with the closing price for February 5, 2010 and February 4, 2011.


Symbol Name 2010 2011 % change
SRCL Stericycle $52.00 $83.63 60.83%
QCOM QUALCOMM $38.04 $55.23 45.19%
FSLR First Solar $114.19 $157.94 38.31%
GENZ Genzyme $55.17 $73.40 33.04%
ATVI Activision Blizzard $10.21 $11.74 14.99%
ERTS Electronic Arts $17.26 $18.23 5.62%
GILD Gilead Sciences $46.38 $38.79 -16.36%
APOL Apollo Group $59.93 $42.14 -29.68%
Average 18.99%


Our watchlist from last year did quite well.  Only one in four stocks from our list registered losses.  Stericycle (SRCL), Qualcomm (QCOM), First Solar (FSLR) and Genzyme (GENZ) either matched or exceeded the returns of the Nasdaq 100 Index (QLD).

Please revisit New Low Observer for edits and revisions to this post. Email us.