
In today's research recommendation of NWN, I will cover the issue of cyclicality, the Coppock Curve, natural gas prices, and Dow's theory as it relates to the stock. I have compiled this information as I consider buying NWN. It is hoped that you thoroughly review NWN from all angles before committing any money to this accomplished Dividend Achiever.
When someone asks me about any cyclical stocks that I might be able to suggest, I often stammer at the thought. In fact, I'm clueless as any true cyclical stocks. However, after a considerable review of NWN, I can prove that it is definitely a true cyclical stock. First, NWN has exhibited a pattern of hitting a relatively low price between the months of January and May since 1970.
The stock hitting a low during the first five months of the year occurred 87% of the time. New lows during the months of February, March and April took place 78% of the time within the period from January to May. The month of February comprised 33% of the new lows between January and May. From the numbers that I ran, February and April are the most optimum month to consider buying this stock.
Next up is the Coppock Curve for NWN. In the chart below, you can seen that the Coppock Curve along with a 14-month trendline. After falling below the zero line, the rise crossing over the trendline indicated a ideal buying point on the first day of November 1994 at an adjusted price of $7.67. Subsequently, the stock reached an adjusted high of $16.74 in December of 1997.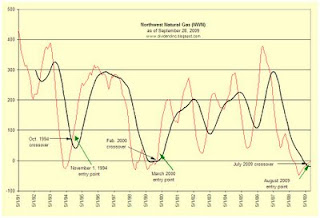
The next point when the Coppock Curve was crossed by the 14-month trendline was in February 2000. If you bought the stock on the first day of March 2000 at the adjusted price of $12.70, you would have seen the shares rise to an adjusted price of $52.19 on September 18, 2008. The rise from March 2000 to September 2008 is in spite of the bear market which began in October 2007. Currently, NWN's Coppock Curve has just crossed above the 14-month trendline. All indications are that this is a buying point based on the Coppock Curve.
Next up is the natural gas wellhead price from 1977 to the present. In the chart below, I have indicated the points where, based on the Coppock Curve, the price crossed above the 14-month trendline. It appears that the Curve accurately called the bottom in the price, almost to the very lowest point possible. From this indication, it appears that the natural gas wellhead price is about to rise from here.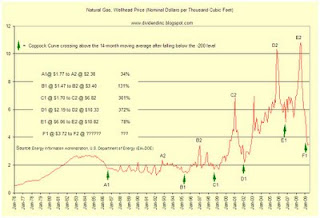
Finally, we'll look at the prospective upside and downside targets for NWN based on Dow's Theory.
Upside:
-
$42.31
-
$48.01
-
$53.71
-
$36.20 (fair value)
-
$30.30
-
$18.50