
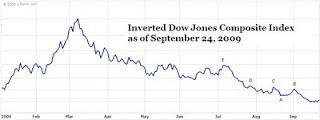
In the chart below, we see a one year diagram of the Dow Jones Composite index of 65 companies. The composite index briefly exceeded the November 4, 2008 high of 3407.33 by only 1.82 points on September 16, 2009. It is important to know that the high for the day of September 16, 2009 did not exceed the high for the day of November 4, 2008. The fact that the market cannot go above November 4, 2008 so far has much broader implications than just in the financial arena.
Since the September 16th peak the Dow Jones Composite Index has traced out an interesting pattern lower. This same pattern could not be seen if you looked at any one of the individual indexes alone. In the chart below, we can see where the next destination might be for the markets on the downside.
The following are the prospective downside targets for the Dow Jones Composite Index as represented in the inverted chart above:
- 3293.86-A
- 3185.02-B
- 3151.72-C
- 3125.28-D
- 2812.05-E
Why have I inverted the chart of the index? Because there is uniform agreement among all great Dow Theorists that calling a peak is the most challenging thing to do. It is the nature of humans to be positive, otherwise most progress isn't possible. With the chart showing a bottom instead of a peak we can feel comfortable seeing the prospects for the future. In terms of Dow Theory, the inverted chart allows us to see a bear market from the same context that we can see a potential bull market.
Now, to play further mind games on you, I recommend that you look at the most recent trend of the Composite Index. After posting above the 3407.33 on September 16th at 3409.15, the market has exhibited two lower peaks on the September 18th and September 22nd. This indicates that a market breakdown to the 3293.86 level (point A) is a probability.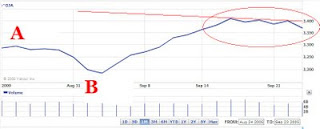
The declines that I have mentioned are in the context of a cyclical bull market within a larger secular bear market. Any of the declines that I have pointed out are all acceptable and constructive for a bull market. Soon after the declines are out of the way we can expect that the market will retest the old high before going higher (both Transports and Industrials) or confirming the previous declining trend.
If you have questions or thoughts then please email me at the following link.