I wrote about Nacco Industries Inc. (
NC) back on
February 6, 2009 and
March 13, 2009 when the stock was trading between the $20 and $40 price range. Please note that during the time of the write up, the market was going through a major breakdown. March 9, 2009 marked the low in the stock market.
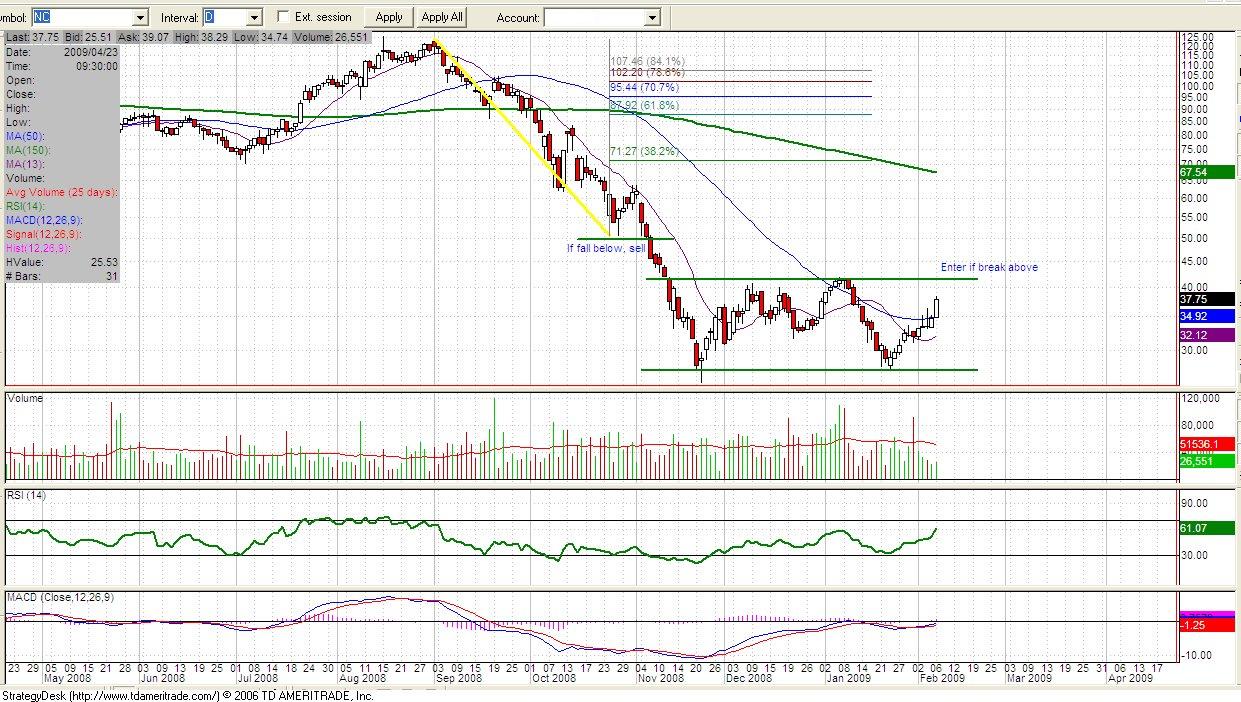
My original article on NC was about its valuation. The company was trading at a ridiculously low valuation based on the book value (assets less liabilities) of $50. The stock was trading at $37.75 or 25% below book value. The dividend yield was 6%. At the time, my concern was the possibility of the dividend being cut and the significant amount of debt. My thesis was also on the prospects for inflation, which didn't really materialize.
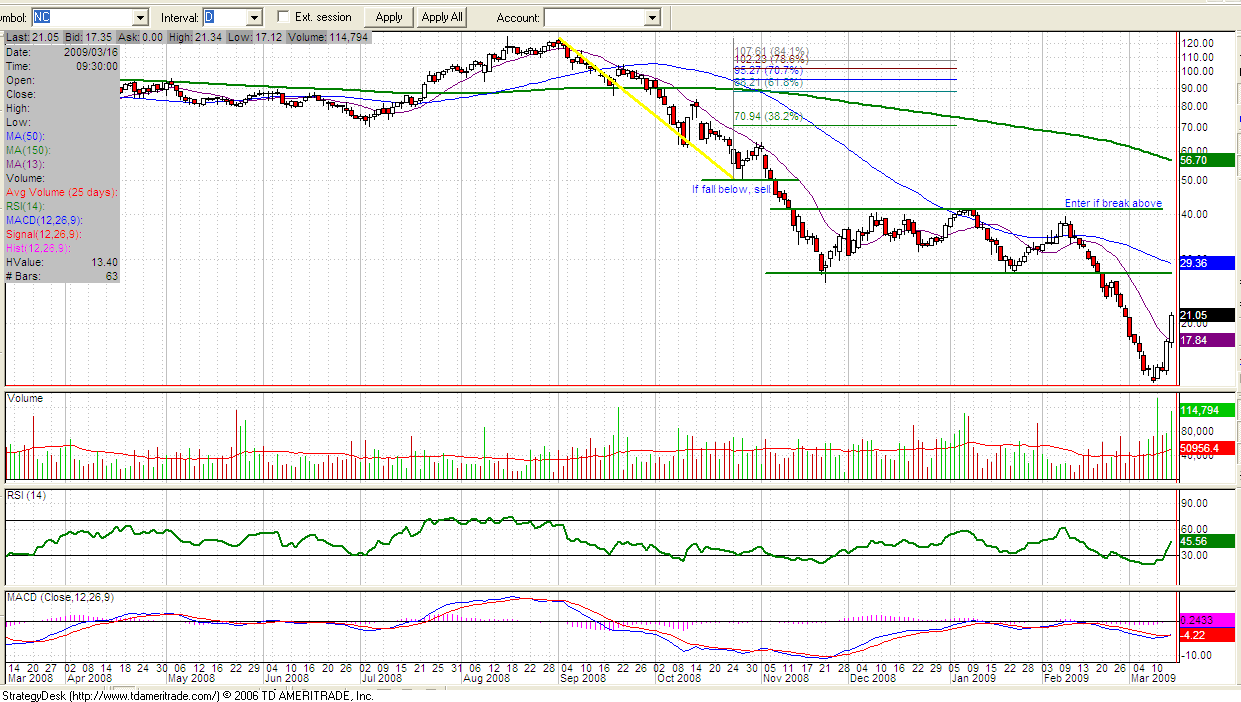
On March 13, the company reported a loss of $51.69 per share. The headline might have scared some people but a closer look showed that things weren't so bad after all. Nacco was forced to take an impairment charge because of the extreme amount of the decline in the stock price. Here is a statement from the 4Q08 conference call.
Because the company’s stock price at year-end was significantly below the company’s book value of tangible assets and its book value of equity, accounting rules effectively required that the company take a non-cash write-off of goodwill and certain other intangible assets totaling $436 million or 431.6 million net of taxes of $4.1 million.
At one point, Nacco was trading a little more than a quarter of their book value ($14 stock price v. $50 book value.) For this reason, accounting rules forced Nacco to write down their asset value. Operations were fine and this change in the book value was just an accounting slight of hand.
So where are we?
Nacco is currently trading around $60 with a book value of $44.85 (1.38x book). The dividend for the last four quarters remained unchanged ($0.5175) and is currently yielding 3.4%. With negative earnings, they are paying their dividend ($4.3 million/qtr) through existing cash of $178.80 million. With large amount of debt and low earnings, we will have to see how Nacco navigate the coming hard times. I expect the dividend to remain unchanged or for the company to raise it by a small amount.
If you purchased this stock based on my writing, I would recommend taking your profits. The risk of the dividends being cut remains a factor at this time. On the upside, if you choose to hold this stock, a possibility of write-up does exist. Those non-cash write-down in fourth quarter could be a catalyst for a NC to pop back to $80 or $100. You have to decide for yourself if you are brave enough to hold on after such nice gains.
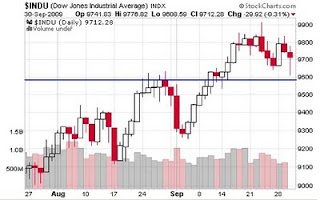
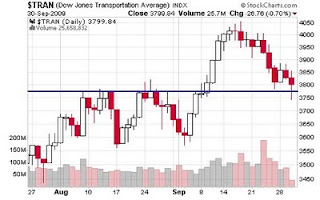
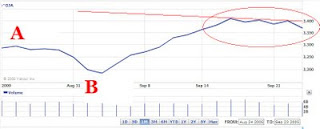
The charts below show where NC was and where it is.
I all my writing, I urged readers to consider the technical pattern. In this case, I recommended buying if, and when, NC broke above $41. I didn't act on my own advice because my attention was diverted to other companies. We will have to see where NC goes from here. For now, let's take the easy money.
Art


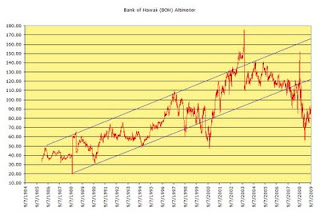 The channel that BOH has managed to fluctuate within suggests that the stock is overvalued at the high end and undervalued at the low end. The period of extreme overvaluation is reflected in 2003 and started to move in a declining trend to undervaluation when BOH increased the dividend from $0.19 to $0.30.
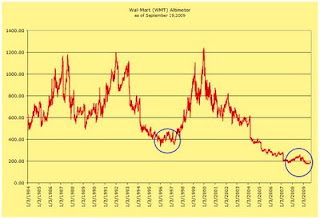
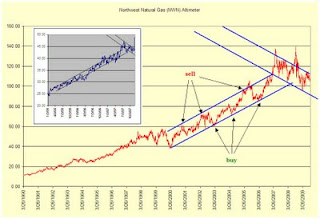
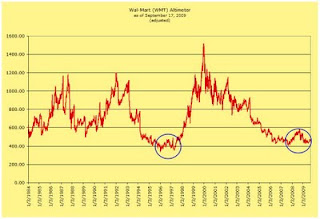 In the first chart, you can see that after 2004 WMT fell to an extreme level of undervaluation. The reason this occur is because WMT continued in increase the dividend at a high rate even though the company didn't have the earnings to support such increases. With diminished earnings, WMT issued more shares to raise capital to fund the dividend payments at the expense of per share earnings.
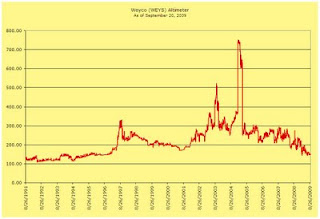
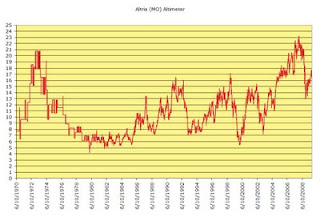 The chart below is also the altimeter for MO however, it reflects the valuation if unadjusted for the spin-off of Kraft (KFT) and Philip Morris International (PM).
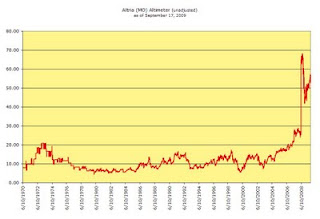 Hopefully these charts give a better understanding of when might be a good time to invest in MO. As you can tell from the first chart, MO is presently considered overvalued. Touc.